|
Download Data (XLS File) |
|
||||||||
|
||||||||
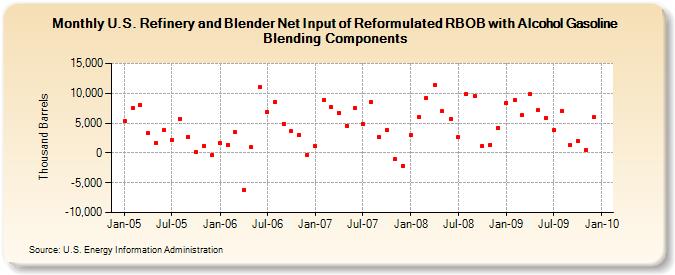
| U.S. Refinery and Blender Net Input of Reformulated RBOB with Alcohol Gasoline Blending Components (Thousand Barrels) | ||||||||
| Year | Jan | Feb | Mar | Apr | May | Jun | Jul | Aug | Sep | Oct | Nov | Dec |
|---|---|---|---|---|---|---|---|---|---|---|---|---|
| 2005 | 5,388 | 7,521 | 8,110 | 3,333 | 1,693 | 3,777 | 2,190 | 5,764 | 2,720 | 125 | 1,139 | -349 |
| 2006 | 1,586 | 1,374 | 3,434 | -6,138 | 929 | 11,004 | 6,826 | 8,583 | 4,924 | 3,652 | 3,021 | -271 |
| 2007 | 1,192 | 8,814 | 7,728 | 6,763 | 4,558 | 7,615 | 4,928 | 8,486 | 2,624 | 3,836 | -1,095 | -2,214 |
| 2008 | 3,005 | 6,016 | 9,243 | 11,341 | 6,983 | 5,733 | 2,595 | 9,841 | 9,463 | 1,174 | 1,382 | 4,212 |
| 2009 | 8,381 | 8,844 | 6,346 | 9,831 | 7,133 | 5,927 | 3,803 | 7,089 | 1,303 | 1,987 | 459 | 5,966 |
| - = No Data Reported; -- = Not Applicable; NA = Not Available; W = Withheld to avoid disclosure of individual company data. |
| Release Date: 3/29/2024 |
| Next Release Date: 4/30/2024 |