|
Download Data (XLS File) |
|
||||||||
|
||||||||
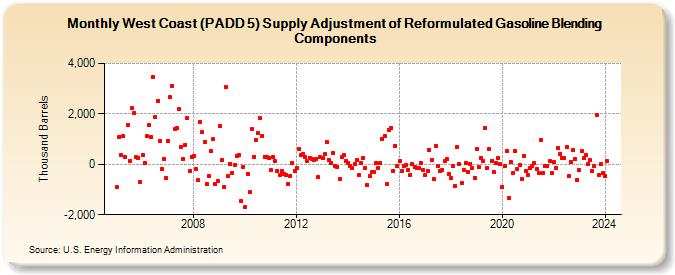
| West Coast (PADD 5) Supply Adjustment of Reformulated Gasoline Blending Components (Thousand Barrels) | ||||||||
| Year | Jan | Feb | Mar | Apr | May | Jun | Jul | Aug | Sep | Oct | Nov | Dec |
|---|---|---|---|---|---|---|---|---|---|---|---|---|
| 2005 | -913 | 1,081 | 360 | 1,118 | 287 | 1,566 | 137 | 2,219 | 2,041 | 273 | 257 | -712 |
| 2006 | 351 | 36 | 1,114 | 1,551 | 1,079 | 3,467 | 1,864 | 2,502 | 943 | -196 | 195 | -537 |
| 2007 | 917 | 2,658 | 3,101 | 1,389 | 1,437 | 2,183 | 698 | 214 | 776 | 1,822 | -246 | 287 |
| 2008 | 327 | -206 | -636 | 1,686 | 1,262 | 904 | -786 | -467 | 525 | 995 | -795 | -678 |
| 2009 | 1,536 | 180 | -913 | 3,067 | -470 | 30 | -353 | -12 | 332 | 375 | -1,455 | -93 |
| 2010 | -1,700 | -372 | -1,107 | 1,405 | 295 | 979 | 1,237 | 1,827 | 1,133 | 302 | 299 | 234 |
| 2011 | -245 | 275 | 120 | -258 | -444 | -256 | -371 | -419 | -770 | -457 | 58 | -258 |
| 2012 | -128 | 615 | 374 | 410 | 270 | 138 | 267 | 212 | 183 | 199 | -520 | 270 |
| 2013 | 241 | 407 | 892 | 190 | 41 | 459 | -81 | -95 | -578 | 285 | 354 | 134 |
| 2014 | 62 | -72 | -161 | 21 | 156 | -444 | 44 | 244 | -146 | -817 | -456 | -323 |
| 2015 | -311 | 48 | -145 | 53 | 1,021 | 1,139 | -780 | 1,367 | 1,441 | -274 | 737 | -83 |
| 2016 | 121 | -271 | -72 | -37 | -223 | -410 | 16 | -116 | -133 | -154 | 37 | -231 |
| 2017 | -429 | -259 | 563 | 170 | -591 | 711 | -48 | -261 | -219 | 135 | 197 | -366 |
| 2018 | -561 | -76 | -855 | 679 | 13 | -759 | -218 | 70 | -298 | 25 | -134 | -553 |
| 2019 | 590 | -113 | 250 | 123 | 1,454 | -129 | 623 | 143 | -291 | 34 | 244 | -7 |
| 2020 | -910 | -85 | 511 | -1,356 | 91 | -327 | 521 | -206 | -34 | -580 | 330 | -254 |
| 2021 | -433 | -160 | -60 | 55 | -194 | -332 | 951 | -350 | -71 | -71 | 124 | -329 |
| 2022 | 85 | -161 | 665 | 420 | 249 | 259 | 684 | -480 | 89 | 564 | 208 | -612 |
| 2023 | -209 | 522 | 245 | 357 | 25 | 167 | -266 | -80 | 1,973 | -436 | -6 | -333 |
| 2024 | -474 | |||||||||||
| - = No Data Reported; -- = Not Applicable; NA = Not Available; W = Withheld to avoid disclosure of individual company data. |
| Release Date: 3/29/2024 |
| Next Release Date: 4/30/2024 |