|
Download Data (XLS File) |
|
||||||||
|
||||||||
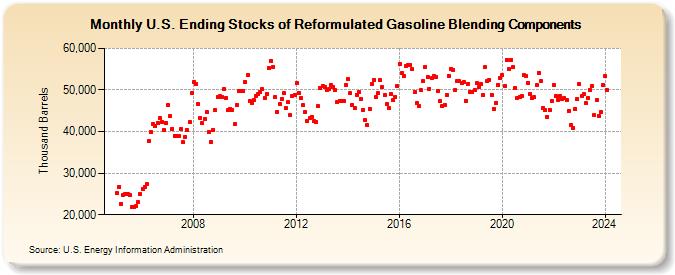
| U.S. Ending Stocks of Reformulated Gasoline Blending Components (Thousand Barrels) | ||||||||
| Year | Jan | Feb | Mar | Apr | May | Jun | Jul | Aug | Sep | Oct | Nov | Dec |
|---|---|---|---|---|---|---|---|---|---|---|---|---|
| 2005 | 25,126 | 26,784 | 22,686 | 24,805 | 25,049 | 25,093 | 24,668 | 21,871 | 21,848 | 22,053 | 22,971 | 24,893 |
| 2006 | 26,138 | 26,684 | 27,333 | 37,677 | 39,833 | 41,857 | 41,320 | 42,134 | 43,177 | 42,406 | 40,404 | 42,168 |
| 2007 | 46,271 | 43,670 | 40,694 | 38,941 | 38,963 | 38,978 | 40,645 | 37,386 | 38,768 | 40,290 | 42,291 | 49,388 |
| 2008 | 51,948 | 51,466 | 46,655 | 43,279 | 42,008 | 43,062 | 44,618 | 39,856 | 37,450 | 40,430 | 45,144 | 48,302 |
| 2009 | 48,467 | 48,403 | 50,272 | 48,154 | 45,110 | 45,504 | 45,185 | 41,713 | 46,472 | 49,715 | 49,707 | 49,782 |
| 2010 | 51,880 | 53,510 | 47,395 | 46,933 | 47,512 | 48,594 | 48,952 | 49,588 | 50,128 | 48,119 | 48,963 | 55,291 |
| 2011 | 57,001 | 55,595 | 48,192 | 44,820 | 46,544 | 47,875 | 49,201 | 45,641 | 47,009 | 43,861 | 48,644 | 48,762 |
| 2012 | 51,645 | 49,325 | 48,155 | 46,277 | 44,732 | 42,646 | 43,167 | 43,574 | 42,445 | 42,355 | 46,069 | 50,452 |
| 2013 | 50,992 | 50,654 | 50,009 | 50,184 | 51,224 | 50,685 | 49,882 | 47,215 | 47,363 | 47,353 | 47,380 | 51,216 |
| 2014 | 52,573 | 49,199 | 46,336 | 45,714 | 48,872 | 49,422 | 47,925 | 45,196 | 42,775 | 41,512 | 45,454 | 51,332 |
| 2015 | 52,474 | 48,292 | 49,198 | 52,358 | 50,607 | 48,704 | 46,543 | 45,700 | 49,021 | 47,500 | 48,218 | 50,862 |
| 2016 | 56,363 | 54,061 | 53,258 | 55,818 | 55,932 | 55,998 | 54,969 | 49,464 | 46,854 | 46,128 | 49,922 | 52,148 |
| 2017 | 55,560 | 53,087 | 50,351 | 52,866 | 53,431 | 53,102 | 49,863 | 47,330 | 46,134 | 46,433 | 48,891 | 53,447 |
| 2018 | 55,143 | 54,775 | 49,996 | 52,038 | 52,043 | 51,786 | 51,998 | 47,425 | 51,450 | 49,485 | 49,523 | 50,101 |
| 2019 | 51,582 | 50,717 | 51,378 | 48,706 | 55,439 | 52,096 | 52,493 | 48,888 | 45,491 | 46,959 | 51,303 | 52,966 |
| 2020 | 53,546 | 50,920 | 57,259 | 54,991 | 57,289 | 55,450 | 50,540 | 48,187 | 48,276 | 48,576 | 53,546 | 53,444 |
| 2021 | 51,785 | 49,075 | 48,140 | 48,244 | 51,119 | 54,150 | 52,086 | 45,697 | 45,110 | 43,570 | 45,246 | 47,357 |
| 2022 | 51,153 | 48,521 | 47,605 | 48,478 | 47,749 | 47,949 | 47,470 | 45,059 | 41,645 | 40,965 | 45,450 | 47,772 |
| 2023 | 51,548 | 48,329 | 48,615 | 46,671 | 47,778 | 49,936 | 49,996 | 43,903 | 47,723 | 43,936 | 44,361 | 50,531 |
| 2024 | 53,282 | 49,945 | 51,691 | 51,527 | 53,778 | 53,973 | ||||||
| - = No Data Reported; -- = Not Applicable; NA = Not Available; W = Withheld to avoid disclosure of individual company data. |
| Release Date: 8/30/2024 |
| Next Release Date: 9/30/2024 |