|
Download Data (XLS File) |
|
||||||||
|
||||||||
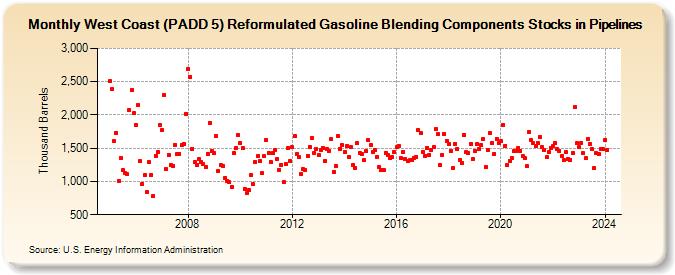
| West Coast (PADD 5) Reformulated Gasoline Blending Components Stocks in Pipelines (Thousand Barrels) | ||||||||
| Year | Jan | Feb | Mar | Apr | May | Jun | Jul | Aug | Sep | Oct | Nov | Dec |
|---|---|---|---|---|---|---|---|---|---|---|---|---|
| 2005 | 2,505 | 2,388 | 1,604 | 1,735 | 1,002 | 1,353 | 1,166 | 1,126 | 1,105 | 2,075 | 2,381 | 2,022 |
| 2006 | 1,853 | 2,148 | 1,303 | 965 | 1,096 | 841 | 1,288 | 1,102 | 781 | 1,380 | 1,449 | 1,856 |
| 2007 | 1,773 | 2,300 | 1,186 | 1,398 | 1,241 | 1,238 | 1,555 | 1,408 | 1,413 | 1,550 | 1,567 | 2,019 |
| 2008 | 2,692 | 2,570 | 1,494 | 1,291 | 1,246 | 1,332 | 1,295 | 1,255 | 1,221 | 1,417 | 1,884 | 1,461 |
| 2009 | 1,424 | 1,679 | 1,156 | 1,241 | 1,231 | 1,059 | 1,007 | 987 | 916 | 1,424 | 1,502 | 1,697 |
| 2010 | 1,572 | 1,497 | 887 | 823 | 865 | 1,093 | 956 | 1,298 | 1,376 | 1,303 | 1,120 | 1,376 |
| 2011 | 1,621 | 1,431 | 1,293 | 1,427 | 1,471 | 1,339 | 1,179 | 1,254 | 985 | 1,264 | 1,497 | 1,310 |
| 2012 | 1,514 | 1,680 | 1,415 | 1,365 | 1,116 | 1,187 | 1,171 | 1,386 | 1,520 | 1,660 | 1,431 | 1,487 |
| 2013 | 1,396 | 1,476 | 1,504 | 1,308 | 1,491 | 1,459 | 1,637 | 1,145 | 1,231 | 1,684 | 1,492 | 1,543 |
| 2014 | 1,449 | 1,531 | 1,367 | 1,511 | 1,241 | 1,206 | 1,574 | 1,426 | 1,413 | 1,321 | 1,457 | 1,623 |
| 2015 | 1,548 | 1,446 | 1,466 | 1,370 | 1,210 | 1,176 | 1,174 | 1,433 | 1,391 | 1,345 | 1,365 | 1,440 |
| 2016 | 1,521 | 1,530 | 1,352 | 1,450 | 1,332 | 1,310 | 1,317 | 1,325 | 1,358 | 1,369 | 1,766 | 1,727 |
| 2017 | 1,444 | 1,387 | 1,499 | 1,403 | 1,473 | 1,512 | 1,791 | 1,707 | 1,244 | 1,402 | 1,710 | 1,613 |
| 2018 | 1,564 | 1,459 | 1,208 | 1,565 | 1,486 | 1,328 | 1,282 | 1,699 | 1,440 | 1,431 | 1,570 | 1,332 |
| 2019 | 1,455 | 1,564 | 1,495 | 1,546 | 1,636 | 1,219 | 1,468 | 1,727 | 1,581 | 1,417 | 1,642 | 1,573 |
| 2020 | 1,604 | 1,851 | 1,540 | 1,241 | 1,311 | 1,354 | 1,461 | 1,464 | 1,506 | 1,465 | 1,379 | 1,345 |
| 2021 | 1,227 | 1,743 | 1,616 | 1,571 | 1,530 | 1,578 | 1,674 | 1,517 | 1,476 | 1,363 | 1,438 | 1,504 |
| 2022 | 1,530 | 1,577 | 1,490 | 1,464 | 1,378 | 1,319 | 1,450 | 1,334 | 1,324 | 1,428 | 2,116 | 1,572 |
| 2023 | 1,513 | 1,579 | 1,423 | 1,347 | 1,635 | 1,569 | 1,487 | 1,200 | 1,423 | 1,406 | 1,484 | 1,486 |
| 2024 | 1,626 | |||||||||||
| - = No Data Reported; -- = Not Applicable; NA = Not Available; W = Withheld to avoid disclosure of individual company data. |
| Release Date: 3/29/2024 |
| Next Release Date: 4/30/2024 |