|
Download Data (XLS File) |
|
||||||||
|
||||||||
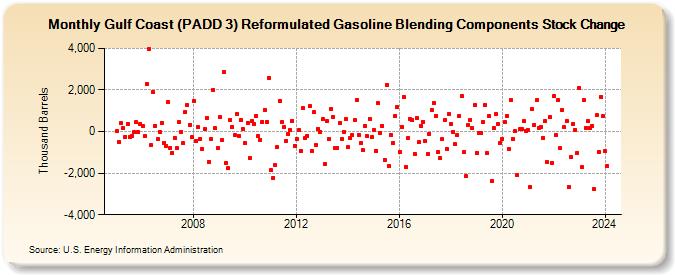
| Gulf Coast (PADD 3) Reformulated Gasoline Blending Components Stock Change (Thousand Barrels) | ||||||||
| Year | Jan | Feb | Mar | Apr | May | Jun | Jul | Aug | Sep | Oct | Nov | Dec |
|---|---|---|---|---|---|---|---|---|---|---|---|---|
| 2005 | 3 | -501 | 393 | 170 | -242 | 371 | -254 | -213 | -27 | 437 | -12 | 358 |
| 2006 | 283 | -214 | 2,280 | 3,957 | -653 | 1,892 | 279 | -377 | -16 | 433 | -538 | -674 |
| 2007 | 1,398 | -772 | -1,009 | -292 | -793 | 444 | -2 | -572 | 931 | 1,264 | 335 | -284 |
| 2008 | 1,485 | -444 | 200 | -368 | -836 | 129 | 668 | -1,443 | -335 | 2,006 | 153 | -798 |
| 2009 | 677 | -398 | 2,863 | -1,505 | -1,774 | 572 | 222 | -170 | 843 | -190 | 555 | 118 |
| 2010 | -558 | 429 | -1,264 | 501 | 373 | 770 | -222 | -400 | 478 | 1,047 | 483 | 2,564 |
| 2011 | -1,870 | -2,212 | -1,626 | -752 | 1,482 | 444 | 208 | -446 | -105 | 70 | 522 | -671 |
| 2012 | -356 | 53 | -932 | 1,127 | -310 | -192 | 1,219 | -937 | 918 | -643 | 138 | 2 |
| 2013 | 598 | -1,563 | 499 | -370 | 1,090 | 708 | -808 | -787 | 431 | -338 | -3 | 603 |
| 2014 | -747 | -328 | -183 | 550 | 1,533 | -167 | -562 | -896 | 255 | -236 | 622 | -285 |
| 2015 | 64 | -917 | 1,357 | -81 | 289 | -1,362 | 2,255 | -1,652 | -168 | -550 | 772 | 1,185 |
| 2016 | -977 | 232 | 1,680 | -1,704 | -306 | 606 | 546 | -1,072 | 644 | -522 | 286 | 480 |
| 2017 | -468 | -1,078 | -94 | 1,049 | 1,381 | 755 | -982 | -1,294 | -376 | 564 | -820 | 840 |
| 2018 | 382 | -34 | -617 | -186 | 760 | 1,727 | -991 | -2,156 | 317 | 572 | 154 | 1,256 |
| 2019 | -1,014 | -59 | -60 | 439 | 1,269 | -1,034 | 731 | -2,396 | 167 | 839 | 362 | -527 |
| 2020 | -355 | 440 | 771 | -853 | 1,514 | -345 | 11 | -2,091 | 106 | 105 | 499 | 50 |
| 2021 | 75 | -2,666 | 1,083 | 311 | 1,495 | 169 | 220 | -291 | 501 | -1,482 | 690 | -1,497 |
| 2022 | 1,692 | -186 | 1,498 | -808 | 1,038 | 197 | 506 | -2,657 | -1,211 | 366 | 88 | -1,030 |
| 2023 | 2,096 | -1,729 | 1,516 | 184 | 517 | 179 | 267 | -2,772 | 778 | -980 | 1,675 | 736 |
| 2024 | -955 | |||||||||||
| - = No Data Reported; -- = Not Applicable; NA = Not Available; W = Withheld to avoid disclosure of individual company data. |
| Release Date: 3/29/2024 |
| Next Release Date: 4/30/2024 |