|
Download Data (XLS File) |
|
||||||||
|
||||||||
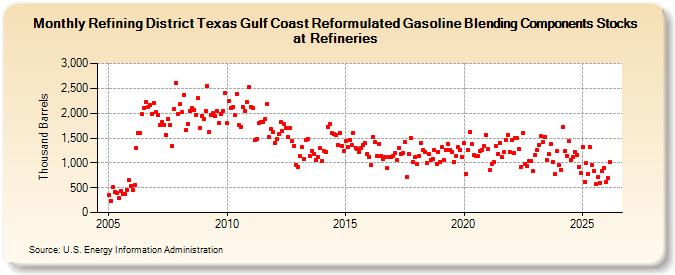
| Refining District Texas Gulf Coast Reformulated Gasoline Blending Components Stocks at Refineries (Thousand Barrels) | ||||||||
| Year | Jan | Feb | Mar | Apr | May | Jun | Jul | Aug | Sep | Oct | Nov | Dec |
|---|---|---|---|---|---|---|---|---|---|---|---|---|
| 2005 | 344 | 233 | 508 | 423 | 400 | 291 | 424 | 369 | 372 | 458 | 649 | 531 |
| 2006 | 446 | 551 | 1,301 | 1,595 | 1,602 | 1,976 | 2,114 | 2,221 | 2,133 | 2,167 | 1,992 | 2,205 |
| 2007 | 2,023 | 1,960 | 1,765 | 1,827 | 1,770 | 1,562 | 1,883 | 1,756 | 1,348 | 2,085 | 2,605 | 1,986 |
| 2008 | 2,186 | 2,016 | 2,375 | 1,659 | 1,788 | 2,040 | 2,098 | 2,060 | 1,959 | 2,301 | 1,704 | 1,952 |
| 2009 | 1,889 | 2,043 | 2,549 | 1,626 | 1,963 | 2,009 | 1,939 | 2,040 | 1,811 | 1,991 | 2,050 | 2,410 |
| 2010 | 1,797 | 2,238 | 2,096 | 2,116 | 1,955 | 2,395 | 1,752 | 1,719 | 2,119 | 2,048 | 2,221 | 2,519 |
| 2011 | 2,130 | 2,098 | 1,457 | 1,486 | 1,804 | 1,828 | 1,831 | 1,877 | 2,179 | 1,525 | 1,680 | 1,629 |
| 2012 | 1,405 | 1,484 | 1,576 | 1,817 | 1,639 | 1,777 | 1,710 | 1,518 | 1,707 | 1,432 | 1,349 | 956 |
| 2013 | 921 | 1,133 | 1,317 | 1,070 | 1,458 | 1,482 | 1,148 | 1,245 | 1,187 | 1,051 | 1,116 | 1,293 |
| 2014 | 1,047 | 1,240 | 1,219 | 1,722 | 1,776 | 1,592 | 1,578 | 1,553 | 1,368 | 1,607 | 1,335 | 1,240 |
| 2015 | 1,442 | 1,327 | 1,461 | 1,367 | 1,608 | 1,305 | 1,287 | 1,223 | 1,300 | 1,352 | 1,394 | 1,179 |
| 2016 | 1,121 | 959 | 1,526 | 1,418 | 1,148 | 1,389 | 1,139 | 1,087 | 1,122 | 894 | 1,123 | 1,111 |
| 2017 | 1,134 | 1,201 | 1,065 | 1,308 | 1,184 | 1,192 | 1,415 | 724 | 1,175 | 1,504 | 1,011 | 1,110 |
| 2018 | 983 | 1,130 | 1,404 | 1,255 | 1,224 | 1,003 | 1,172 | 1,063 | 1,083 | 1,261 | 986 | 1,225 |
| 2019 | 1,024 | 1,329 | 1,048 | 1,265 | 1,379 | 1,267 | 1,227 | 1,015 | 1,142 | 1,311 | 1,260 | 1,125 |
| 2020 | 1,394 | 766 | 1,262 | 1,620 | 1,373 | 1,155 | 1,148 | 1,132 | 1,229 | 1,263 | 1,347 | 1,556 |
| 2021 | 1,272 | 849 | 983 | 1,019 | 1,342 | 1,174 | 1,405 | 1,112 | 1,221 | 1,459 | 1,558 | 1,225 |
| 2022 | 1,465 | 1,203 | 1,506 | 1,492 | 1,270 | 912 | 1,607 | 980 | 945 | 1,034 | 1,046 | 832 |
| 2023 | 1,161 | 1,252 | 1,479 | 1,531 | 1,429 | 1,522 | 1,055 | 1,181 | 1,370 | 1,021 | 781 | 1,247 |
| 2024 | 967 | |||||||||||
| - = No Data Reported; -- = Not Applicable; NA = Not Available; W = Withheld to avoid disclosure of individual company data. |
| Release Date: 3/29/2024 |
| Next Release Date: 4/30/2024 |