|
Download Data (XLS File) |
|
||||||||
|
||||||||
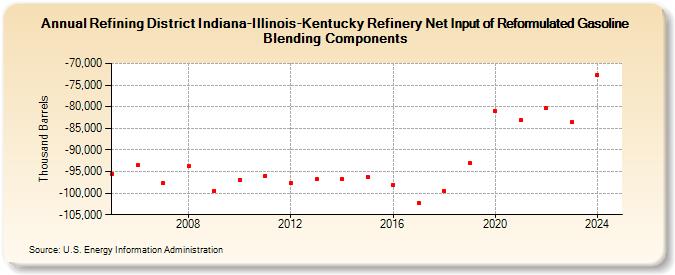
| Refining District Indiana-Illinois-Kentucky Refinery Net Input of Reformulated Gasoline Blending Components (Thousand Barrels) | ||||||||
| Decade | Year-0 | Year-1 | Year-2 | Year-3 | Year-4 | Year-5 | Year-6 | Year-7 | Year-8 | Year-9 |
|---|---|---|---|---|---|---|---|---|---|---|
| 2000's | -95,565 | -93,568 | -97,733 | -93,829 | -99,438 | |||||
| 2010's | -96,916 | -95,936 | -97,729 | -96,748 | -96,715 | -96,175 | -98,045 | -102,179 | -99,542 | -93,013 |
| 2020's | -81,034 | -83,081 | -80,336 | -83,618 |
| - = No Data Reported; -- = Not Applicable; NA = Not Available; W = Withheld to avoid disclosure of individual company data. |
| Release Date: 3/29/2024 |
| Next Release Date: 8/30/2024 |