|
Download Data (XLS File) |
|
||||||||
|
||||||||
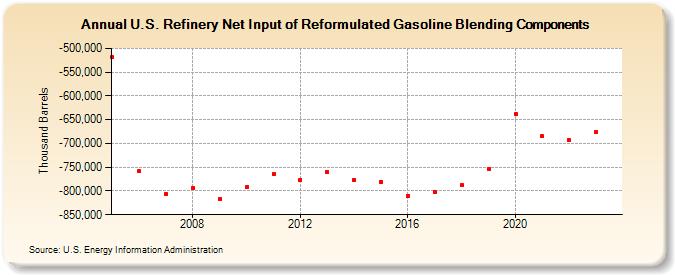
| U.S. Refinery Net Input of Reformulated Gasoline Blending Components (Thousand Barrels) | ||||||||
| Decade | Year-0 | Year-1 | Year-2 | Year-3 | Year-4 | Year-5 | Year-6 | Year-7 | Year-8 | Year-9 |
|---|---|---|---|---|---|---|---|---|---|---|
| 2000's | -519,019 | -759,044 | -805,515 | -794,190 | -816,876 | |||||
| 2010's | -791,781 | -764,141 | -776,043 | -760,134 | -776,119 | -781,594 | -810,033 | -802,376 | -787,642 | -753,079 |
| 2020's | -637,885 | -685,405 | -693,356 | -676,482 |
| - = No Data Reported; -- = Not Applicable; NA = Not Available; W = Withheld to avoid disclosure of individual company data. |
| Release Date: 8/30/2024 |
| Next Release Date: 8/29/2025 |