|
Download Data (XLS File) |
|
||||||||
|
||||||||
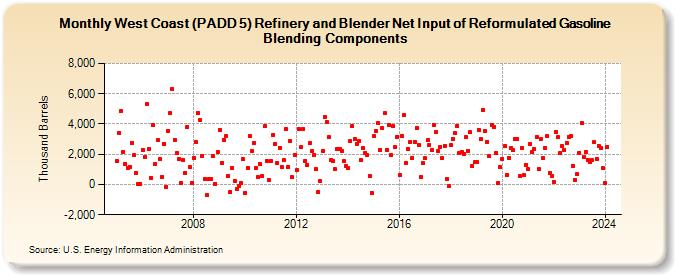
| West Coast (PADD 5) Refinery and Blender Net Input of Reformulated Gasoline Blending Components (Thousand Barrels) | ||||||||
| Year | Jan | Feb | Mar | Apr | May | Jun | Jul | Aug | Sep | Oct | Nov | Dec |
|---|---|---|---|---|---|---|---|---|---|---|---|---|
| 2005 | 1,538 | 3,409 | 4,828 | 2,140 | 1,367 | 1,105 | 1,157 | 2,767 | 1,916 | 779 | 57 | 60 |
| 2006 | 2,311 | 1,814 | 5,339 | 2,369 | 440 | 3,920 | 1,380 | 2,909 | 1,654 | 516 | 2,699 | -135 |
| 2007 | 3,556 | 4,707 | 6,319 | 2,946 | 2,107 | 1,679 | 129 | 1,622 | 778 | 3,798 | 1,159 | 85 |
| 2008 | 1,779 | 2,802 | 4,738 | 4,231 | 1,906 | 380 | -722 | 340 | 368 | 1,862 | 62 | 2,162 |
| 2009 | 3,619 | 1,443 | 2,955 | 3,195 | 569 | -468 | 1,116 | 248 | -294 | -113 | 99 | 1,672 |
| 2010 | -561 | 1,107 | 3,230 | 2,196 | 2,769 | 1,102 | 467 | 1,377 | 527 | 3,837 | 1,578 | 289 |
| 2011 | 1,547 | 3,295 | 2,695 | 1,439 | 2,431 | 1,174 | 1,591 | 3,674 | 1,173 | 2,862 | 464 | 1,951 |
| 2012 | 948 | 3,641 | 2,463 | 3,698 | 1,580 | 1,272 | 2,733 | 2,211 | 1,968 | 1,010 | -498 | 202 |
| 2013 | 2,244 | 4,470 | 4,121 | 3,111 | 1,636 | 1,540 | 1,005 | 2,319 | 2,331 | 2,245 | 1,567 | 1,196 |
| 2014 | 1,116 | 2,849 | 3,844 | 3,005 | 2,644 | 2,884 | 1,588 | 2,433 | 2,074 | 1,930 | 581 | -532 |
| 2015 | 3,215 | 3,560 | 4,065 | 2,310 | 3,737 | 4,695 | 2,268 | 3,959 | 1,941 | 3,838 | 2,461 | 3,165 |
| 2016 | 635 | 3,216 | 4,587 | 1,430 | 2,329 | 2,804 | 1,758 | 2,810 | 3,759 | 2,596 | 506 | 1,388 |
| 2017 | 1,725 | 2,922 | 2,634 | 2,271 | 3,920 | 3,462 | 2,206 | 2,481 | 1,744 | 2,558 | 382 | -113 |
| 2018 | 2,619 | 3,018 | 3,379 | 3,890 | 2,070 | 2,146 | 2,031 | 3,117 | 2,245 | 3,450 | 1,212 | 1,455 |
| 2019 | 1,462 | 3,608 | 2,974 | 4,922 | 3,554 | 2,811 | 1,857 | 3,955 | 3,829 | 2,091 | 112 | 1,155 |
| 2020 | 1,696 | 2,529 | 646 | 1,723 | 2,435 | 2,249 | 3,005 | 3,012 | 558 | 2,421 | 603 | 1,309 |
| 2021 | 1,017 | 2,704 | 2,160 | 2,329 | 3,144 | 1,006 | 2,976 | 1,752 | 2,429 | 3,195 | 767 | 529 |
| 2022 | 194 | 3,485 | 3,111 | 2,088 | 2,515 | 2,278 | 2,760 | 3,159 | 3,231 | 1,214 | 288 | 664 |
| 2023 | 2,104 | 4,052 | 1,818 | 2,152 | 1,618 | 1,518 | 1,594 | 2,776 | 1,698 | 2,548 | 2,412 | 1,079 |
| 2024 | 75 | |||||||||||
| - = No Data Reported; -- = Not Applicable; NA = Not Available; W = Withheld to avoid disclosure of individual company data. |
| Release Date: 3/29/2024 |
| Next Release Date: 4/30/2024 |