|
Download Data (XLS File) |
|
||||||||
|
||||||||
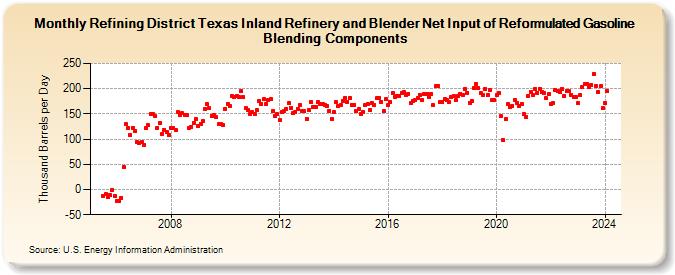
| Refining District Texas Inland Refinery and Blender Net Input of Reformulated Gasoline Blending Components (Thousand Barrels per Day) | ||||||||
| Year | Jan | Feb | Mar | Apr | May | Jun | Jul | Aug | Sep | Oct | Nov | Dec |
|---|---|---|---|---|---|---|---|---|---|---|---|---|
| 2005 | -13 | -9 | -15 | -11 | -1 | -12 | ||||||
| 2006 | -23 | -23 | -16 | 44 | 129 | 122 | 108 | 123 | 117 | 95 | 93 | 94 |
| 2007 | 89 | 123 | 127 | 150 | 150 | 145 | 123 | 132 | 111 | 119 | 114 | 109 |
| 2008 | 122 | 123 | 118 | 153 | 148 | 151 | 148 | 148 | 123 | 124 | 132 | 139 |
| 2009 | 126 | 130 | 135 | 160 | 169 | 161 | 146 | 147 | 143 | 129 | 129 | 127 |
| 2010 | 160 | 170 | 166 | 186 | 184 | 185 | 184 | 195 | 183 | 161 | 158 | 150 |
| 2011 | 153 | 150 | 157 | 176 | 169 | 179 | 170 | 177 | 179 | 155 | 146 | 149 |
| 2012 | 137 | 154 | 155 | 160 | 171 | 162 | 151 | 153 | 160 | 168 | 156 | 155 |
| 2013 | 140 | 158 | 174 | 164 | 164 | 173 | 169 | 169 | 168 | 166 | 156 | 140 |
| 2014 | 154 | 174 | 166 | 168 | 176 | 182 | 174 | 181 | 168 | 168 | 156 | 159 |
| 2015 | 150 | 153 | 167 | 169 | 158 | 171 | 168 | 181 | 181 | 174 | 155 | 179 |
| 2016 | 167 | 174 | 191 | 184 | 185 | 186 | 191 | 193 | 187 | 190 | 171 | 175 |
| 2017 | 177 | 182 | 188 | 178 | 190 | 190 | 183 | 190 | 167 | 205 | 206 | 173 |
| 2018 | 173 | 179 | 177 | 173 | 183 | 186 | 177 | 185 | 190 | 188 | 200 | 192 |
| 2019 | 172 | 176 | 202 | 210 | 201 | 191 | 187 | 199 | 187 | 197 | 178 | 178 |
| 2020 | 187 | 191 | 145 | 98 | 139 | 169 | 164 | 166 | 178 | 172 | 166 | 170 |
| 2021 | 150 | 144 | 186 | 193 | 188 | 200 | 192 | 200 | 194 | 191 | 181 | 189 |
| 2022 | 170 | 172 | 197 | 196 | 193 | 200 | 186 | 196 | 195 | 188 | 184 | 183 |
| 2023 | 171 | 187 | 203 | 210 | 210 | 204 | 207 | 230 | 205 | 194 | 205 | 162 |
| 2024 | 171 | |||||||||||
| - = No Data Reported; -- = Not Applicable; NA = Not Available; W = Withheld to avoid disclosure of individual company data. |
| Release Date: 3/29/2024 |
| Next Release Date: 4/30/2024 |