|
Download Data (XLS File) |
|
||||||||
|
||||||||
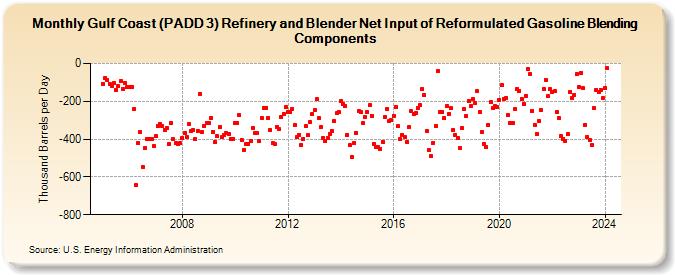
| Gulf Coast (PADD 3) Refinery and Blender Net Input of Reformulated Gasoline Blending Components (Thousand Barrels per Day) | ||||||||
| Year | Jan | Feb | Mar | Apr | May | Jun | Jul | Aug | Sep | Oct | Nov | Dec |
|---|---|---|---|---|---|---|---|---|---|---|---|---|
| 2005 | -106 | -78 | -89 | -106 | -119 | -104 | -140 | -121 | -92 | -134 | -101 | -124 |
| 2006 | -123 | -122 | -242 | -645 | -422 | -364 | -547 | -448 | -400 | -402 | -398 | -436 |
| 2007 | -385 | -330 | -318 | -331 | -350 | -341 | -425 | -314 | -401 | -422 | -428 | -423 |
| 2008 | -394 | -369 | -388 | -322 | -359 | -352 | -401 | -355 | -160 | -364 | -329 | -314 |
| 2009 | -317 | -287 | -363 | -416 | -385 | -337 | -389 | -378 | -368 | -371 | -397 | -398 |
| 2010 | -313 | -313 | -275 | -403 | -456 | -428 | -428 | -411 | -340 | -366 | -369 | -410 |
| 2011 | -287 | -235 | -233 | -288 | -353 | -421 | -427 | -334 | -348 | -282 | -265 | -232 |
| 2012 | -259 | -259 | -239 | -328 | -391 | -377 | -432 | -399 | -332 | -380 | -311 | -266 |
| 2013 | -248 | -189 | -289 | -338 | -392 | -411 | -394 | -371 | -355 | -305 | -264 | -256 |
| 2014 | -201 | -214 | -225 | -378 | -430 | -497 | -423 | -366 | -253 | -258 | -315 | -283 |
| 2015 | -256 | -220 | -276 | -425 | -443 | -444 | -451 | -414 | -283 | -240 | -304 | -299 |
| 2016 | -276 | -230 | -332 | -402 | -378 | -388 | -416 | -337 | -253 | -265 | -260 | -233 |
| 2017 | -220 | -134 | -168 | -357 | -457 | -492 | -419 | -332 | -40 | -259 | -257 | -290 |
| 2018 | -225 | -266 | -237 | -353 | -379 | -395 | -449 | -341 | -241 | -277 | -198 | -224 |
| 2019 | -188 | -208 | -148 | -257 | -360 | -425 | -444 | -323 | -205 | -236 | -225 | -229 |
| 2020 | -191 | -116 | -189 | -182 | -273 | -317 | -317 | -243 | -136 | -145 | -188 | -214 |
| 2021 | -171 | -29 | -58 | -250 | -325 | -373 | -305 | -248 | -134 | -86 | -173 | -137 |
| 2022 | -152 | -147 | -255 | -290 | -383 | -398 | -410 | -374 | -150 | -181 | -167 | -56 |
| 2023 | -127 | -49 | -132 | -324 | -388 | -403 | -430 | -238 | -139 | -153 | -138 | -184 |
| 2024 | -129 | |||||||||||
| - = No Data Reported; -- = Not Applicable; NA = Not Available; W = Withheld to avoid disclosure of individual company data. |
| Release Date: 3/29/2024 |
| Next Release Date: 4/30/2024 |