|
Download Data (XLS File) |
|
||||||||
|
||||||||
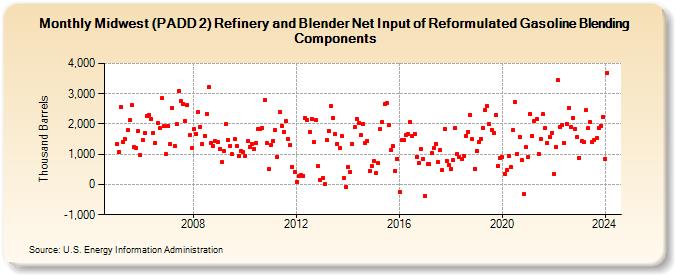
| Midwest (PADD 2) Refinery and Blender Net Input of Reformulated Gasoline Blending Components (Thousand Barrels) | ||||||||
| Year | Jan | Feb | Mar | Apr | May | Jun | Jul | Aug | Sep | Oct | Nov | Dec |
|---|---|---|---|---|---|---|---|---|---|---|---|---|
| 2005 | 1,330 | 1,079 | 2,549 | 1,418 | 1,493 | 1,798 | 2,118 | 2,629 | 1,233 | 1,216 | 1,769 | 971 |
| 2006 | 1,471 | 1,699 | 2,280 | 2,311 | 2,166 | 1,711 | 1,383 | 2,035 | 1,860 | 2,843 | 1,925 | 991 |
| 2007 | 1,928 | 1,333 | 2,541 | 1,270 | 1,998 | 3,104 | 2,748 | 2,665 | 2,101 | 2,613 | 1,619 | 1,191 |
| 2008 | 1,825 | 1,679 | 2,389 | 1,916 | 1,334 | 1,612 | 2,340 | 3,221 | 1,375 | 1,258 | 1,428 | 1,404 |
| 2009 | 1,178 | 731 | 1,106 | 1,987 | 1,476 | 1,273 | 993 | 1,503 | 1,284 | 951 | 1,096 | 1,071 |
| 2010 | 949 | 1,421 | 1,253 | 1,332 | 1,177 | 1,363 | 1,819 | 1,832 | 1,874 | 2,782 | 1,376 | 506 |
| 2011 | 1,321 | 1,432 | 1,816 | 906 | 2,395 | 1,948 | 1,739 | 2,088 | 1,506 | 1,300 | 589 | 405 |
| 2012 | 95 | 274 | 300 | 289 | 2,197 | 2,127 | 1,733 | 2,178 | 1,397 | 2,133 | 606 | 140 |
| 2013 | 224 | -1 | 1,464 | 1,777 | 2,593 | 2,191 | 1,675 | 1,349 | 1,192 | 1,605 | 230 | -76 |
| 2014 | 569 | 411 | 1,345 | 1,897 | 2,176 | 2,027 | 1,628 | 2,003 | 1,355 | 1,446 | 453 | 612 |
| 2015 | 774 | 376 | 709 | 1,830 | 2,057 | 2,649 | 2,690 | 1,955 | 1,131 | 1,273 | 450 | 844 |
| 2016 | -257 | 1,467 | 1,464 | 1,626 | 1,679 | 2,053 | 1,611 | 1,685 | 918 | 720 | 1,161 | 849 |
| 2017 | -387 | 673 | 663 | 1,031 | 1,206 | 1,350 | 737 | 1,130 | 471 | 1,844 | 785 | 629 |
| 2018 | 524 | 801 | 1,872 | 1,000 | 899 | 850 | 934 | 1,616 | 1,747 | 2,310 | 1,488 | 524 |
| 2019 | 1,101 | 1,408 | 1,510 | 1,882 | 2,460 | 2,592 | 2,001 | 1,817 | 1,718 | 2,290 | 624 | 866 |
| 2020 | 905 | 354 | 464 | 955 | 576 | 1,805 | 2,721 | 1,021 | 1,565 | 804 | -331 | 1,237 |
| 2021 | 909 | 2,341 | 1,612 | 2,111 | 2,157 | 1,018 | 1,504 | 2,314 | 1,869 | 1,368 | 1,581 | 1,716 |
| 2022 | 355 | 1,232 | 3,442 | 1,903 | 1,974 | 1,383 | 1,993 | 2,542 | 1,897 | 2,203 | 1,849 | 1,572 |
| 2023 | 878 | 1,422 | 1,409 | 2,448 | 1,852 | 2,056 | 1,407 | 1,478 | 1,535 | 1,855 | 1,943 | 2,242 |
| 2024 | 843 | |||||||||||
| - = No Data Reported; -- = Not Applicable; NA = Not Available; W = Withheld to avoid disclosure of individual company data. |
| Release Date: 3/29/2024 |
| Next Release Date: 4/30/2024 |