|
Download Data (XLS File) |
|
||||||||
|
||||||||
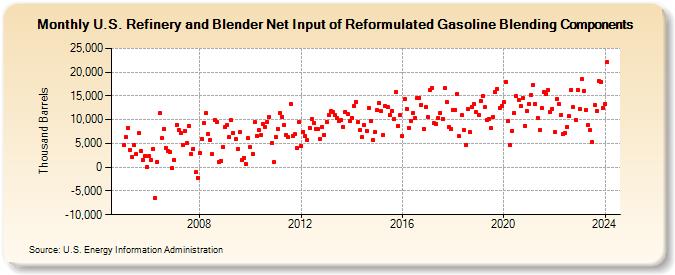
| U.S. Refinery and Blender Net Input of Reformulated Gasoline Blending Components (Thousand Barrels) | ||||||||
| Year | Jan | Feb | Mar | Apr | May | Jun | Jul | Aug | Sep | Oct | Nov | Dec |
|---|---|---|---|---|---|---|---|---|---|---|---|---|
| 2005 | 4,647 | 6,312 | 8,237 | 3,720 | 2,174 | 4,590 | 2,736 | 7,158 | 3,333 | 1,518 | 2,310 | -23 |
| 2006 | 2,363 | 1,565 | 3,845 | -6,509 | 1,125 | 11,333 | 6,069 | 8,101 | 4,111 | 3,355 | 3,199 | -251 |
| 2007 | 1,550 | 8,944 | 7,856 | 7,103 | 4,620 | 7,677 | 5,064 | 8,645 | 2,725 | 3,899 | -1,095 | -2,214 |
| 2008 | 3,005 | 6,016 | 9,313 | 11,341 | 7,084 | 5,733 | 2,703 | 9,882 | 9,463 | 1,174 | 1,382 | 4,212 |
| 2009 | 8,408 | 8,844 | 6,346 | 9,831 | 7,206 | 5,930 | 3,803 | 7,339 | 1,595 | 1,987 | 596 | 6,066 |
| 2010 | 4,176 | 2,783 | 9,409 | 6,633 | 7,741 | 6,725 | 9,009 | 8,503 | 9,539 | 10,611 | 5,087 | 990 |
| 2011 | 6,305 | 8,129 | 11,481 | 10,620 | 8,800 | 6,789 | 6,268 | 13,357 | 6,632 | 6,902 | 4,016 | 9,442 |
| 2012 | 4,436 | 7,491 | 6,492 | 5,646 | 8,307 | 10,102 | 9,315 | 8,080 | 7,985 | 5,963 | 8,553 | 6,790 |
| 2013 | 9,472 | 11,056 | 11,771 | 11,523 | 10,898 | 10,271 | 9,655 | 9,839 | 8,555 | 11,669 | 11,200 | 9,621 |
| 2014 | 10,413 | 12,879 | 13,672 | 9,425 | 7,828 | 6,307 | 8,908 | 7,699 | 12,450 | 9,697 | 5,760 | 7,477 |
| 2015 | 12,009 | 13,458 | 11,768 | 6,849 | 12,778 | 12,660 | 10,880 | 11,766 | 10,123 | 15,753 | 8,736 | 10,987 |
| 2016 | 6,555 | 14,246 | 12,301 | 8,352 | 9,794 | 11,428 | 10,307 | 14,628 | 14,601 | 13,112 | 8,055 | 12,625 |
| 2017 | 10,607 | 16,340 | 16,672 | 9,239 | 9,113 | 10,276 | 11,419 | 10,198 | 16,567 | 13,699 | 8,461 | 8,106 |
| 2018 | 12,102 | 12,099 | 15,492 | 6,500 | 10,928 | 7,866 | 4,606 | 12,167 | 7,334 | 12,715 | 13,362 | 11,571 |
| 2019 | 10,940 | 13,929 | 14,919 | 12,592 | 9,981 | 10,225 | 8,147 | 10,666 | 15,884 | 16,521 | 12,414 | 12,928 |
| 2020 | 13,620 | 18,011 | 9,621 | 4,570 | 7,707 | 11,405 | 14,914 | 14,083 | 12,857 | 14,514 | 8,745 | 11,816 |
| 2021 | 13,355 | 15,142 | 17,333 | 13,310 | 10,440 | 7,860 | 12,406 | 15,782 | 15,405 | 16,196 | 11,567 | 12,289 |
| 2022 | 7,368 | 14,247 | 13,373 | 11,041 | 7,088 | 7,229 | 8,537 | 10,806 | 16,321 | 12,593 | 10,012 | 16,339 |
| 2023 | 12,281 | 18,416 | 16,720 | 11,939 | 8,792 | 7,581 | 5,299 | 13,182 | 11,644 | 18,240 | 18,027 | 12,390 |
| 2024 | 13,353 | 22,084 | 19,850 | 11,633 | 10,451 | 12,566 | ||||||
| - = No Data Reported; -- = Not Applicable; NA = Not Available; W = Withheld to avoid disclosure of individual company data. |
| Release Date: 8/30/2024 |
| Next Release Date: 9/30/2024 |