|
Download Data (XLS File) |
|
||||||||
|
||||||||
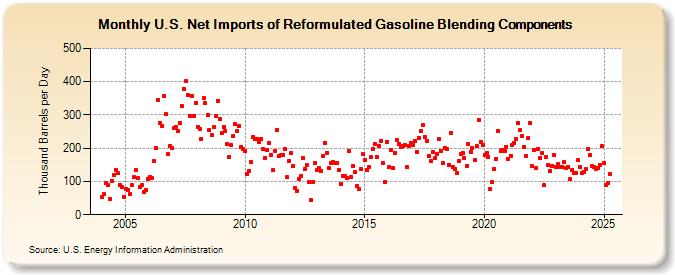
| U.S. Net Imports of Reformulated Gasoline Blending Components (Thousand Barrels per Day) | ||||||||
| Year | Jan | Feb | Mar | Apr | May | Jun | Jul | Aug | Sep | Oct | Nov | Dec |
|---|---|---|---|---|---|---|---|---|---|---|---|---|
| 2004 | 54 | 61 | 94 | 90 | 48 | 102 | 120 | 135 | 124 | 90 | 84 | 53 |
| 2005 | 77 | 75 | 62 | 90 | 112 | 135 | 109 | 83 | 88 | 69 | 74 | 108 |
| 2006 | 113 | 109 | 162 | 200 | 344 | 276 | 268 | 358 | 302 | 182 | 208 | 201 |
| 2007 | 260 | 265 | 253 | 277 | 328 | 379 | 402 | 361 | 296 | 356 | 297 | 336 |
| 2008 | 265 | 258 | 227 | 352 | 335 | 300 | 254 | 239 | 263 | 296 | 342 | 288 |
| 2009 | 245 | 264 | 251 | 213 | 173 | 209 | 238 | 272 | 251 | 266 | 205 | 197 |
| 2010 | 191 | 121 | 131 | 159 | 235 | 229 | 227 | 220 | 227 | 197 | 171 | 196 |
| 2011 | 216 | 180 | 134 | 193 | 254 | 177 | 179 | 180 | 197 | 112 | 162 | 187 |
| 2012 | 147 | 79 | 70 | 106 | 117 | 171 | 138 | 150 | 97 | 44 | 99 | 155 |
| 2013 | 133 | 139 | 130 | 177 | 217 | 187 | 139 | 155 | 159 | 155 | 154 | 134 |
| 2014 | 93 | 115 | 115 | 110 | 193 | 112 | 145 | 127 | 87 | 78 | 136 | 184 |
| 2015 | 165 | 134 | 143 | 172 | 197 | 214 | 175 | 206 | 222 | 154 | 98 | 218 |
| 2016 | 144 | 196 | 139 | 185 | 225 | 212 | 205 | 207 | 210 | 142 | 208 | 215 |
| 2017 | 209 | 222 | 190 | 232 | 251 | 269 | 235 | 223 | 178 | 160 | 190 | 169 |
| 2018 | 182 | 227 | 193 | 154 | 201 | 199 | 149 | 246 | 144 | 137 | 125 | 162 |
| 2019 | 182 | 187 | 169 | 146 | 212 | 189 | 201 | 163 | 206 | 286 | 219 | 209 |
| 2020 | 180 | 185 | 173 | 76 | 98 | 138 | 167 | 251 | 192 | 196 | 191 | 205 |
| 2021 | 167 | 178 | 210 | 217 | 227 | 275 | 254 | 238 | 205 | 178 | 232 | 277 |
| 2022 | 145 | 194 | 140 | 197 | 170 | 186 | 88 | 172 | 150 | 131 | 145 | 179 |
| 2023 | 142 | 153 | 142 | 144 | 158 | 140 | 144 | 106 | 133 | 125 | 126 | 163 |
| 2024 | 144 | 125 | ||||||||||
| - = No Data Reported; -- = Not Applicable; NA = Not Available; W = Withheld to avoid disclosure of individual company data. |
| Release Date: 4/30/2024 |
| Next Release Date: 5/31/2024 |