|
Download Data (XLS File) |
|
||||||||
|
||||||||
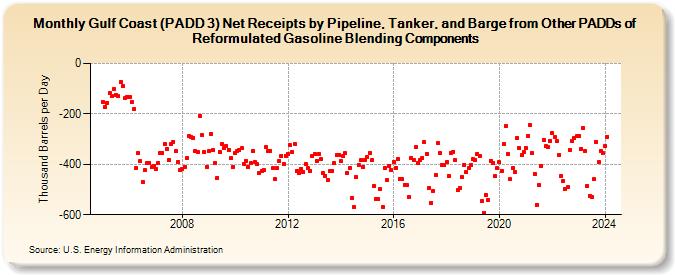
| Gulf Coast (PADD 3) Net Receipts by Pipeline, Tanker, and Barge from Other PADDs of Reformulated Gasoline Blending Components (Thousand Barrels per Day) | ||||||||
| Year | Jan | Feb | Mar | Apr | May | Jun | Jul | Aug | Sep | Oct | Nov | Dec |
|---|---|---|---|---|---|---|---|---|---|---|---|---|
| 2005 | -151 | -171 | -155 | -119 | -129 | -102 | -125 | -130 | -74 | -91 | -138 | -131 |
| 2006 | -134 | -153 | -181 | -413 | -357 | -388 | -471 | -423 | -396 | -393 | -411 | -408 |
| 2007 | -418 | -394 | -354 | -356 | -320 | -339 | -382 | -318 | -310 | -349 | -389 | -423 |
| 2008 | -417 | -409 | -376 | -286 | -290 | -295 | -348 | -351 | -209 | -285 | -352 | -411 |
| 2009 | -349 | -278 | -344 | -395 | -454 | -351 | -318 | -334 | -328 | -343 | -376 | -411 |
| 2010 | -357 | -348 | -344 | -337 | -397 | -385 | -411 | -396 | -348 | -389 | -400 | -435 |
| 2011 | -427 | -422 | -331 | -348 | -347 | -416 | -459 | -414 | -387 | -366 | -400 | -366 |
| 2012 | -360 | -325 | -352 | -318 | -425 | -436 | -417 | -430 | -399 | -415 | -425 | -369 |
| 2013 | -359 | -386 | -358 | -380 | -436 | -445 | -462 | -428 | -425 | -396 | -364 | -362 |
| 2014 | -386 | -367 | -357 | -435 | -414 | -533 | -570 | -450 | -402 | -384 | -412 | -381 |
| 2015 | -372 | -355 | -384 | -485 | -539 | -538 | -498 | -569 | -414 | -463 | -405 | -423 |
| 2016 | -390 | -413 | -379 | -457 | -459 | -481 | -483 | -531 | -374 | -382 | -333 | -395 |
| 2017 | -382 | -375 | -313 | -358 | -495 | -552 | -505 | -443 | -316 | -357 | -401 | -404 |
| 2018 | -391 | -445 | -355 | -350 | -383 | -502 | -493 | -450 | -401 | -431 | -416 | -403 |
| 2019 | -380 | -382 | -358 | -367 | -546 | -592 | -522 | -540 | -385 | -394 | -448 | -416 |
| 2020 | -392 | -425 | -321 | -248 | -359 | -460 | -415 | -430 | -296 | -337 | -365 | -350 |
| 2021 | -335 | -287 | -245 | -356 | -437 | -560 | -483 | -405 | -302 | -329 | -332 | -307 |
| 2022 | -277 | -293 | -308 | -362 | -446 | -466 | -497 | -492 | -342 | -309 | -297 | -289 |
| 2023 | -289 | -339 | -254 | -348 | -487 | -524 | -529 | -460 | -310 | -391 | -347 | -356 |
| 2024 | -328 | |||||||||||
| - = No Data Reported; -- = Not Applicable; NA = Not Available; W = Withheld to avoid disclosure of individual company data. |
| Release Date: 3/29/2024 |
| Next Release Date: 4/30/2024 |