|
Download Data (XLS File) |
|
||||||||
|
||||||||
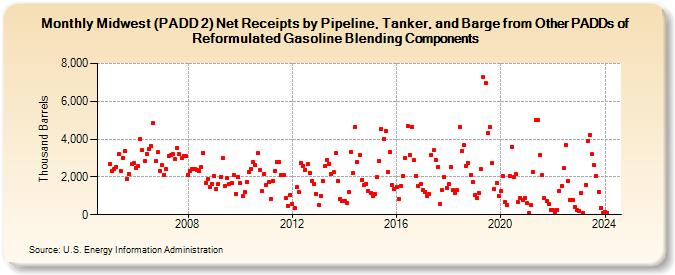
| Midwest (PADD 2) Net Receipts by Pipeline, Tanker, and Barge from Other PADDs of Reformulated Gasoline Blending Components (Thousand Barrels) | ||||||||
| Year | Jan | Feb | Mar | Apr | May | Jun | Jul | Aug | Sep | Oct | Nov | Dec |
|---|---|---|---|---|---|---|---|---|---|---|---|---|
| 2005 | 2,672 | 2,322 | 2,407 | 2,537 | 3,193 | 2,333 | 2,983 | 3,362 | 1,899 | 2,163 | 2,666 | 2,720 |
| 2006 | 2,457 | 2,551 | 3,999 | 3,410 | 2,836 | 3,230 | 3,467 | 3,649 | 4,849 | 2,826 | 3,303 | 2,319 |
| 2007 | 2,615 | 2,122 | 2,429 | 3,095 | 3,155 | 3,190 | 2,922 | 3,550 | 3,209 | 2,985 | 3,106 | 3,123 |
| 2008 | 2,120 | 2,305 | 2,404 | 2,444 | 2,370 | 2,303 | 2,511 | 3,278 | 1,698 | 1,872 | 1,480 | 1,651 |
| 2009 | 2,041 | 1,384 | 1,633 | 2,010 | 3,006 | 1,513 | 1,951 | 1,632 | 1,667 | 2,121 | 1,109 | 1,983 |
| 2010 | 1,671 | 1,001 | 1,184 | 1,735 | 2,238 | 2,417 | 2,794 | 2,629 | 3,247 | 2,355 | 1,259 | 2,146 |
| 2011 | 1,579 | 1,740 | 815 | 1,805 | 2,337 | 2,785 | 2,796 | 2,103 | 2,086 | 880 | 483 | 1,051 |
| 2012 | 576 | 337 | 1,448 | 1,199 | 2,749 | 2,593 | 2,364 | 2,668 | 2,226 | 1,809 | 1,641 | 1,108 |
| 2013 | 527 | 1,015 | 1,792 | 2,555 | 2,902 | 2,707 | 2,153 | 2,239 | 3,264 | 1,784 | 834 | 720 |
| 2014 | 702 | 624 | 1,177 | 3,338 | 2,229 | 4,658 | 2,812 | 3,133 | 1,842 | 1,549 | 1,645 | 1,277 |
| 2015 | 1,124 | 1,009 | 1,117 | 1,969 | 2,839 | 4,510 | 4,001 | 4,429 | 2,251 | 3,314 | 1,560 | 1,346 |
| 2016 | 1,490 | 851 | 1,533 | 2,052 | 2,986 | 4,667 | 3,166 | 4,655 | 2,907 | 2,043 | 1,493 | 1,610 |
| 2017 | 1,286 | 1,192 | 968 | 1,097 | 3,162 | 3,402 | 2,918 | 2,527 | 574 | 1,320 | 1,993 | 1,431 |
| 2018 | 1,623 | 2,544 | 1,289 | 1,153 | 1,289 | 4,630 | 3,365 | 3,680 | 2,589 | 2,739 | 2,119 | 1,733 |
| 2019 | 1,024 | 907 | 1,164 | 2,393 | 7,270 | 6,960 | 4,341 | 4,666 | 2,730 | 1,345 | 1,681 | 1,012 |
| 2020 | 1,248 | 2,028 | 660 | 504 | 2,022 | 3,600 | 1,982 | 2,151 | 655 | 864 | 768 | 888 |
| 2021 | 614 | 77 | 513 | 2,265 | 4,993 | 5,014 | 3,169 | 2,075 | 864 | 734 | 556 | 240 |
| 2022 | 255 | 169 | 252 | 1,252 | 1,512 | 2,448 | 3,672 | 1,799 | 779 | 785 | 417 | 234 |
| 2023 | 204 | 1,123 | 113 | 1,573 | 3,918 | 4,218 | 3,195 | 2,621 | 2,047 | 1,224 | 368 | 115 |
| 2024 | 132 | |||||||||||
| - = No Data Reported; -- = Not Applicable; NA = Not Available; W = Withheld to avoid disclosure of individual company data. |
| Release Date: 3/29/2024 |
| Next Release Date: 4/30/2024 |