|
Download Data (XLS File) |
|
||||||||
|
||||||||
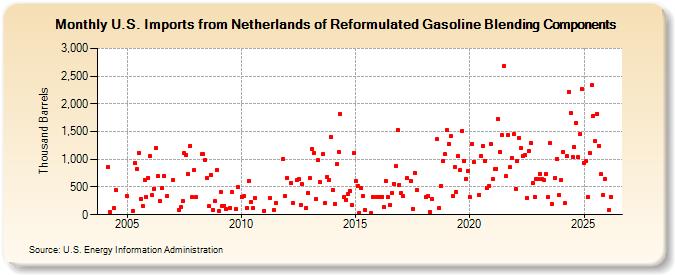
| U.S. Imports from Netherlands of Reformulated Gasoline Blending Components (Thousand Barrels) | ||||||||
| Year | Jan | Feb | Mar | Apr | May | Jun | Jul | Aug | Sep | Oct | Nov | Dec |
|---|---|---|---|---|---|---|---|---|---|---|---|---|
| 2004 | 858 | 56 | 121 | 440 | ||||||||
| 2005 | 329 | 75 | 929 | 825 | 1,118 | 282 | 159 | 630 | 319 | 667 | ||
| 2006 | 1,057 | 348 | 469 | 1,199 | 691 | 246 | 477 | 702 | 336 | |||
| 2007 | 631 | 81 | 135 | 251 | 1,112 | 1,085 | 730 | 1,246 | 312 | 802 | ||
| 2008 | 318 | 1,088 | 1,089 | 993 | 660 | 150 | 725 | 81 | 243 | 809 | ||
| 2009 | 65 | 412 | 150 | 162 | 96 | 125 | 404 | 100 | 498 | |||
| 2010 | 326 | 329 | 126 | 607 | 236 | 120 | 310 | |||||
| 2011 | 74 | 303 | 88 | 218 | 1,002 | 336 | ||||||
| 2012 | 663 | 571 | 218 | 622 | 639 | 182 | 546 | 129 | 398 | |||
| 2013 | 657 | 1,187 | 1,109 | 285 | 979 | 599 | 1,091 | 212 | 686 | 629 | 1,409 | |
| 2014 | 442 | 200 | 909 | 1,139 | 1,820 | 323 | 274 | 372 | 436 | 180 | 1,113 | |
| 2015 | 607 | 522 | 32 | 479 | 344 | 82 | 38 | 326 | 324 | |||
| 2016 | 322 | 328 | 133 | 604 | 314 | 177 | 397 | 563 | 872 | 1,525 | 542 | |
| 2017 | 385 | 329 | 660 | 607 | 108 | 757 | 447 | |||||
| 2018 | 311 | 334 | 56 | 284 | 1,359 | 124 | 524 | 976 | 1,088 | |||
| 2019 | 1,530 | 1,276 | 1,415 | 342 | 862 | 414 | 1,058 | 802 | 1,508 | 977 | 652 | 793 |
| 2020 | 321 | 1,279 | 950 | 359 | 1,063 | 1,237 | 974 | 490 | 525 | 1,273 | ||
| 2021 | 648 | 817 | 830 | 1,725 | 1,132 | 1,437 | 2,685 | 690 | 1,439 | 855 | 1,029 | 1,449 |
| 2022 | 470 | 971 | 1,388 | 1,199 | 1,059 | 1,081 | 310 | 1,155 | 1,294 | 576 | 324 | 644 |
| 2023 | 643 | 743 | 642 | 625 | 738 | 319 | 1,295 | 189 | 667 | 1,011 | 350 | |
| 2024 | 620 | |||||||||||
| - = No Data Reported; -- = Not Applicable; NA = Not Available; W = Withheld to avoid disclosure of individual company data. |
| Release Date: 3/29/2024 |
| Next Release Date: 4/30/2024 |