|
Download Data (XLS File) |
|
||||||||
|
||||||||
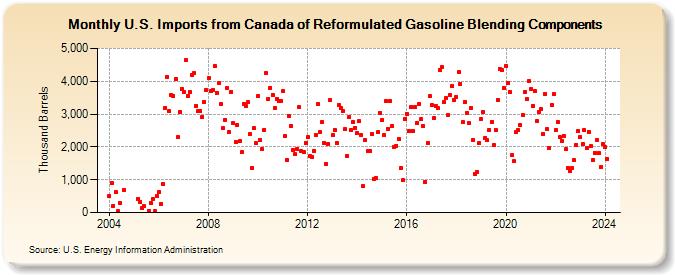
| U.S. Imports from Canada of Reformulated Gasoline Blending Components (Thousand Barrels) | ||||||||
| Year | Jan | Feb | Mar | Apr | May | Jun | Jul | Aug | Sep | Oct | Nov | Dec |
|---|---|---|---|---|---|---|---|---|---|---|---|---|
| 2004 | 509 | 896 | 215 | 627 | 35 | 298 | 689 | |||||
| 2005 | 425 | 329 | 126 | 190 | 50 | 280 | 417 | 38 | 504 | |||
| 2006 | 621 | 254 | 855 | 3,185 | 4,127 | 3,086 | 3,589 | 3,559 | 4,074 | 2,291 | 3,064 | 3,773 |
| 2007 | 3,658 | 4,633 | 3,560 | 3,667 | 4,202 | 4,244 | 3,248 | 3,080 | 3,100 | 2,908 | 3,368 | 3,730 |
| 2008 | 4,092 | 3,699 | 3,726 | 4,463 | 3,656 | 3,942 | 3,294 | 2,566 | 2,833 | 3,800 | 2,449 | 3,679 |
| 2009 | 2,721 | 2,157 | 2,668 | 2,165 | 1,834 | 3,321 | 3,246 | 3,359 | 2,382 | 1,367 | 2,564 | 2,109 |
| 2010 | 3,550 | 2,217 | 1,925 | 2,524 | 4,237 | 3,471 | 3,804 | 3,592 | 3,185 | 3,471 | 3,392 | 3,387 |
| 2011 | 3,699 | 2,324 | 1,610 | 2,935 | 2,635 | 1,910 | 1,779 | 1,937 | 3,210 | 1,865 | 1,844 | 2,115 |
| 2012 | 2,292 | 1,710 | 1,705 | 1,889 | 2,359 | 3,314 | 2,444 | 2,751 | 2,126 | 1,481 | 2,095 | 3,427 |
| 2013 | 2,350 | 2,522 | 2,106 | 3,283 | 3,176 | 3,087 | 2,536 | 1,718 | 2,912 | 2,513 | 2,763 | 2,587 |
| 2014 | 2,423 | 2,775 | 2,355 | 796 | 2,207 | 1,867 | 1,889 | 2,400 | 1,025 | 1,056 | 2,443 | 3,046 |
| 2015 | 2,829 | 2,353 | 3,396 | 2,548 | 3,402 | 2,642 | 2,011 | 2,040 | 2,253 | 1,350 | 982 | 2,852 |
| 2016 | 3,002 | 2,490 | 3,217 | 2,489 | 3,227 | 2,740 | 3,314 | 2,838 | 2,635 | 940 | 2,117 | 3,535 |
| 2017 | 3,272 | 2,871 | 3,251 | 3,190 | 4,348 | 4,424 | 3,363 | 3,496 | 2,959 | 3,575 | 3,862 | 3,413 |
| 2018 | 3,534 | 4,270 | 3,917 | 2,750 | 3,373 | 3,033 | 2,735 | 3,187 | 2,206 | 1,176 | 1,245 | 2,117 |
| 2019 | 2,849 | 3,060 | 2,283 | 2,202 | 2,516 | 2,754 | 2,057 | 2,517 | 3,438 | 4,369 | 4,330 | 3,807 |
| 2020 | 4,468 | 3,931 | 3,664 | 1,764 | 1,559 | 2,465 | 2,508 | 2,664 | 2,981 | 3,680 | 3,450 | 4,007 |
| 2021 | 3,770 | 3,253 | 3,699 | 2,787 | 3,064 | 3,147 | 2,394 | 3,610 | 2,537 | 1,961 | 3,279 | 3,605 |
| 2022 | 2,522 | 2,762 | 2,289 | 2,188 | 2,339 | 1,927 | 1,361 | 1,252 | 1,359 | 1,589 | 2,056 | 2,479 |
| 2023 | 2,305 | 2,080 | 2,503 | 1,978 | 2,466 | 2,012 | 1,594 | 1,822 | 2,196 | 1,807 | 1,386 | 2,087 |
| 2024 | 2,000 | |||||||||||
| - = No Data Reported; -- = Not Applicable; NA = Not Available; W = Withheld to avoid disclosure of individual company data. |
| Release Date: 3/29/2024 |
| Next Release Date: 4/30/2024 |