|
Download Data (XLS File) |
|
||||||||
|
||||||||
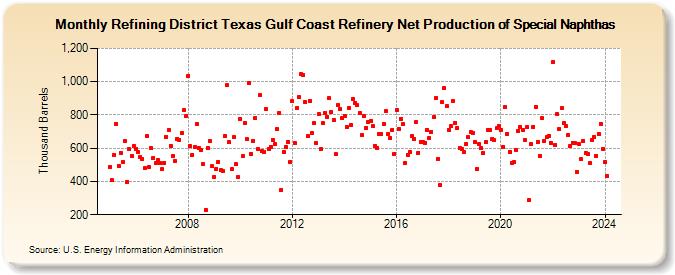
| Refining District Texas Gulf Coast Refinery Net Production of Special Naphthas (Thousand Barrels) | ||||||||
| Year | Jan | Feb | Mar | Apr | May | Jun | Jul | Aug | Sep | Oct | Nov | Dec |
|---|---|---|---|---|---|---|---|---|---|---|---|---|
| 2005 | 488 | 406 | 558 | 747 | 495 | 574 | 515 | 643 | 397 | 596 | 554 | 614 |
| 2006 | 597 | 576 | 546 | 536 | 482 | 671 | 484 | 599 | 542 | 509 | 530 | 513 |
| 2007 | 472 | 513 | 669 | 708 | 615 | 554 | 525 | 658 | 652 | 690 | 827 | 793 |
| 2008 | 1,036 | 612 | 561 | 606 | 745 | 599 | 592 | 503 | 230 | 600 | 642 | 491 |
| 2009 | 427 | 475 | 517 | 468 | 463 | 674 | 978 | 636 | 472 | 665 | 502 | 428 |
| 2010 | 775 | 551 | 754 | 656 | 989 | 567 | 644 | 783 | 593 | 917 | 583 | 579 |
| 2011 | 835 | 596 | 610 | 652 | 625 | 715 | 813 | 350 | 579 | 610 | 640 | 518 |
| 2012 | 882 | 630 | 842 | 906 | 1,047 | 1,041 | 877 | 674 | 886 | 690 | 750 | 632 |
| 2013 | 803 | 596 | 751 | 813 | 790 | 899 | 817 | 772 | 565 | 859 | 838 | 779 |
| 2014 | 794 | 728 | 842 | 739 | 896 | 873 | 857 | 811 | 679 | 794 | 723 | 760 |
| 2015 | 762 | 734 | 616 | 603 | 686 | 686 | 745 | 821 | 686 | 663 | 711 | 568 |
| 2016 | 830 | 716 | 778 | 746 | 512 | 562 | 579 | 672 | 655 | 758 | 573 | 638 |
| 2017 | 640 | 633 | 712 | 659 | 698 | 787 | 903 | 537 | 381 | 876 | 961 | 851 |
| 2018 | 711 | 731 | 882 | 753 | 720 | 599 | 598 | 578 | 624 | 667 | 696 | 693 |
| 2019 | 636 | 477 | 624 | 602 | 570 | 635 | 712 | 710 | 657 | 648 | 719 | 734 |
| 2020 | 712 | 609 | 845 | 685 | 579 | 513 | 516 | 590 | 705 | 726 | 709 | 652 |
| 2021 | 725 | 288 | 625 | 730 | 850 | 638 | 555 | 779 | 645 | 667 | 674 | 631 |
| 2022 | 1,117 | 618 | 805 | 716 | 839 | 750 | 731 | 679 | 616 | 633 | 631 | 459 |
| 2023 | 625 | 532 | 643 | 574 | 564 | 512 | 650 | 670 | 555 | 687 | 746 | 598 |
| 2024 | 517 | |||||||||||
| - = No Data Reported; -- = Not Applicable; NA = Not Available; W = Withheld to avoid disclosure of individual company data. |
| Release Date: 3/29/2024 |
| Next Release Date: 4/30/2024 |