|
Download Data (XLS File) |
|
||||||||
|
||||||||
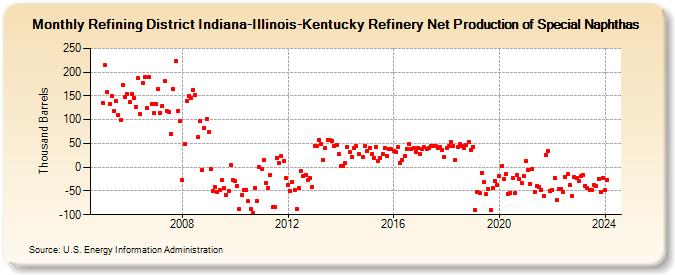
| Refining District Indiana-Illinois-Kentucky Refinery Net Production of Special Naphthas (Thousand Barrels) | ||||||||
| Year | Jan | Feb | Mar | Apr | May | Jun | Jul | Aug | Sep | Oct | Nov | Dec |
|---|---|---|---|---|---|---|---|---|---|---|---|---|
| 2005 | 135 | 214 | 158 | 134 | 149 | 119 | 139 | 110 | 99 | 174 | 148 | 154 |
| 2006 | 137 | 154 | 145 | 127 | 187 | 111 | 178 | 190 | 125 | 190 | 133 | 113 |
| 2007 | 133 | 165 | 115 | 129 | 181 | 119 | 116 | 70 | 164 | 224 | 118 | 98 |
| 2008 | -28 | 48 | 140 | 149 | 145 | 162 | 152 | 63 | 97 | -6 | 82 | 101 |
| 2009 | 74 | -3 | -51 | -42 | -53 | -48 | -28 | -44 | -58 | -50 | 4 | -28 |
| 2010 | -29 | -40 | -88 | -59 | -47 | -49 | -72 | -89 | -96 | -43 | -71 | 0 |
| 2011 | -3 | 15 | -34 | -44 | -17 | -84 | -83 | 20 | 9 | 23 | 14 | -23 |
| 2012 | -37 | -51 | -31 | -47 | -88 | -43 | -9 | -18 | -16 | -27 | -23 | -42 |
| 2013 | 44 | 44 | 58 | 48 | 15 | 40 | 58 | 58 | 55 | 45 | 47 | 27 |
| 2014 | 2 | 2 | 8 | 42 | 33 | 22 | 40 | 44 | 28 | 21 | 44 | |
| 2015 | 34 | 41 | 27 | 19 | 43 | 13 | 20 | 28 | 41 | 24 | 39 | 38 |
| 2016 | 35 | 33 | 43 | 9 | 15 | 24 | 39 | 48 | 39 | 40 | 33 | 40 |
| 2017 | 28 | 39 | 42 | 38 | 41 | 45 | 45 | 44 | 41 | 43 | 37 | 22 |
| 2018 | 40 | 44 | 53 | 45 | 16 | 43 | 48 | 45 | 41 | 46 | 54 | 36 |
| 2019 | 43 | -90 | -52 | -55 | -12 | -32 | -57 | -46 | -91 | -44 | -29 | -37 |
| 2020 | -18 | 2 | -24 | -14 | -57 | -54 | -23 | -55 | -17 | -25 | -34 | -19 |
| 2021 | 14 | -5 | -35 | -3 | -52 | -39 | -41 | -48 | -60 | 26 | 34 | -50 |
| 2022 | -47 | -22 | -68 | -46 | -46 | -52 | -20 | -15 | -37 | -60 | -21 | -23 |
| 2023 | -29 | -19 | -16 | -39 | -44 | -47 | -47 | -38 | -40 | -24 | -52 | -22 |
| 2024 | -49 | |||||||||||
| - = No Data Reported; -- = Not Applicable; NA = Not Available; W = Withheld to avoid disclosure of individual company data. |
| Release Date: 3/29/2024 |
| Next Release Date: 4/30/2024 |