|
Download Data (XLS File) |
|
||||||||
|
||||||||
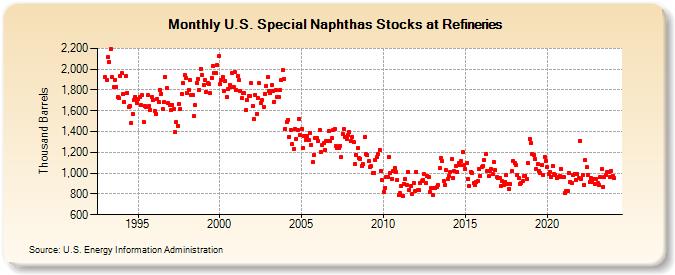
| U.S. Special Naphthas Stocks at Refineries (Thousand Barrels) | ||||||||
| Year | Jan | Feb | Mar | Apr | May | Jun | Jul | Aug | Sep | Oct | Nov | Dec |
|---|---|---|---|---|---|---|---|---|---|---|---|---|
| 1993 | 1,920 | 1,900 | 2,113 | 2,065 | 2,194 | 1,923 | 1,824 | 1,897 | 1,830 | 1,732 | 1,718 | 1,933 |
| 1994 | 1,961 | 1,762 | 1,684 | 1,930 | 1,771 | 1,638 | 1,647 | 1,487 | 1,573 | 1,699 | 1,735 | 1,674 |
| 1995 | 1,711 | 1,731 | 1,655 | 1,748 | 1,494 | 1,647 | 1,639 | 1,749 | 1,645 | 1,608 | 1,734 | 1,707 |
| 1996 | 1,599 | 1,569 | 1,716 | 1,685 | 1,803 | 1,766 | 1,616 | 1,681 | 1,929 | 1,817 | 1,674 | 1,655 |
| 1997 | 1,604 | 1,658 | 1,614 | 1,394 | 1,492 | 1,456 | 1,664 | 1,618 | 1,765 | 1,867 | 1,941 | 1,917 |
| 1998 | 1,769 | 1,803 | 1,895 | 1,749 | 1,756 | 1,547 | 1,655 | 1,870 | 1,906 | 1,803 | 2,005 | 1,943 |
| 1999 | 1,852 | 1,895 | 1,783 | 1,864 | 1,856 | 1,769 | 1,918 | 2,033 | 1,963 | 1,964 | 2,038 | 2,122 |
| 2000 | 1,854 | 1,899 | 1,925 | 1,791 | 1,884 | 1,732 | 1,810 | 1,847 | 1,829 | 1,962 | 1,833 | 1,970 |
| 2001 | 1,804 | 1,932 | 1,897 | 1,787 | 1,720 | 1,772 | 1,768 | 1,607 | 1,703 | 1,740 | 1,743 | 1,867 |
| 2002 | 1,647 | 1,520 | 1,754 | 1,572 | 1,720 | 1,863 | 1,671 | 1,702 | 1,638 | 1,766 | 1,838 | 1,922 |
| 2003 | 1,793 | 1,773 | 1,844 | 1,792 | 1,689 | 1,795 | 1,729 | 1,733 | 1,796 | 1,893 | 1,991 | 1,909 |
| 2004 | 1,428 | 1,491 | 1,514 | 1,350 | 1,413 | 1,277 | 1,230 | 1,425 | 1,328 | 1,412 | 1,519 | 1,368 |
| 2005 | 1,428 | 1,242 | 1,356 | 1,319 | 1,354 | 1,320 | 1,390 | 1,274 | 1,103 | 1,171 | 1,342 | 1,337 |
| 2006 | 1,309 | 1,416 | 1,204 | 1,270 | 1,286 | 1,225 | 1,312 | 1,311 | 1,404 | 1,313 | 1,336 | 1,411 |
| 2007 | 1,428 | 1,261 | 1,243 | 1,244 | 1,265 | 1,152 | 1,379 | 1,421 | 1,351 | 1,333 | 1,368 | 1,394 |
| 2008 | 1,309 | 1,348 | 1,296 | 1,087 | 1,175 | 1,243 | 1,141 | 1,139 | 1,072 | 1,084 | 1,346 | 1,181 |
| 2009 | 1,178 | 1,114 | 1,058 | 1,067 | 999 | 1,005 | 1,124 | 1,151 | 1,180 | 1,227 | 1,018 | 932 |
| 2010 | 822 | 858 | 964 | 965 | 1,153 | 997 | 947 | 1,019 | 1,052 | 1,015 | 938 | 791 |
| 2011 | 805 | 875 | 783 | 899 | 941 | 889 | 1,014 | 842 | 880 | 803 | 909 | 824 |
| 2012 | 1,009 | 836 | 835 | 907 | 920 | 935 | 988 | 905 | 974 | 960 | 820 | 855 |
| 2013 | 785 | 857 | 855 | 863 | 883 | 1,045 | 1,147 | 1,115 | 928 | 890 | 1,026 | 943 |
| 2014 | 972 | 1,015 | 1,134 | 953 | 1,018 | 1,070 | 1,013 | 1,094 | 1,075 | 1,116 | 1,202 | 1,074 |
| 2015 | 1,035 | 1,096 | 944 | 876 | 1,012 | 1,004 | 902 | 889 | 910 | 923 | 1,041 | 974 |
| 2016 | 1,055 | 1,073 | 1,126 | 1,184 | 1,018 | 970 | 1,019 | 1,035 | 988 | 1,107 | 1,030 | 961 |
| 2017 | 950 | 952 | 878 | 921 | 886 | 918 | 979 | 894 | 849 | 897 | 1,017 | 1,121 |
| 2018 | 1,095 | 1,080 | 986 | 953 | 895 | 909 | 925 | 969 | 975 | 948 | 1,097 | 1,330 |
| 2019 | 1,289 | 1,186 | 1,176 | 1,134 | 1,039 | 1,085 | 1,019 | 1,006 | 1,077 | 985 | 1,159 | 1,118 |
| 2020 | 1,055 | 987 | 1,011 | 966 | 1,071 | 995 | 985 | 951 | 965 | 977 | 1,044 | 962 |
| 2021 | 962 | 813 | 831 | 829 | 1,006 | 919 | 902 | 982 | 995 | 938 | 991 | 951 |
| 2022 | 1,312 | 947 | 980 | 885 | 1,126 | 1,056 | 986 | 913 | 951 | 914 | 940 | 896 |
| 2023 | 945 | 901 | 887 | 962 | 1,041 | 867 | 963 | 981 | 1,008 | 1,010 | 962 | 1,021 |
| 2024 | 976 | |||||||||||
| - = No Data Reported; -- = Not Applicable; NA = Not Available; W = Withheld to avoid disclosure of individual company data. |
| Release Date: 3/29/2024 |
| Next Release Date: 4/30/2024 |