|
Download Data (XLS File) |
|
||||||||
|
||||||||
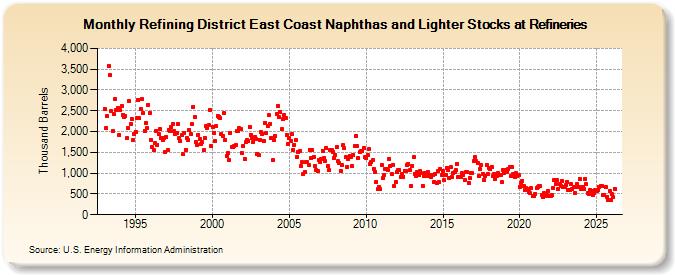
| Refining District East Coast Naphthas and Lighter Stocks at Refineries (Thousand Barrels) | ||||||||
| Year | Jan | Feb | Mar | Apr | May | Jun | Jul | Aug | Sep | Oct | Nov | Dec |
|---|---|---|---|---|---|---|---|---|---|---|---|---|
| 1993 | 2,540 | 2,084 | 2,363 | 3,571 | 3,360 | 2,487 | 2,025 | 2,411 | 2,783 | 2,517 | 2,573 | 1,919 |
| 1994 | 2,512 | 2,626 | 2,406 | 2,344 | 2,371 | 1,837 | 2,077 | 2,727 | 2,179 | 2,300 | 1,806 | 1,934 |
| 1995 | 1,998 | 2,319 | 2,765 | 2,316 | 2,548 | 2,785 | 2,439 | 2,023 | 2,209 | 2,076 | 2,650 | 2,452 |
| 1996 | 1,797 | 1,634 | 1,560 | 1,716 | 2,019 | 1,677 | 1,945 | 2,050 | 1,842 | 1,790 | 1,846 | 1,510 |
| 1997 | 1,864 | 1,548 | 2,034 | 2,002 | 2,104 | 2,191 | 2,019 | 1,936 | 1,972 | 2,184 | 1,843 | 1,771 |
| 1998 | 1,917 | 1,451 | 1,971 | 1,566 | 1,834 | 1,806 | 2,038 | 1,942 | 2,174 | 2,600 | 2,352 | 1,750 |
| 1999 | 1,688 | 1,927 | 1,831 | 1,706 | 1,745 | 1,555 | 1,855 | 2,132 | 2,089 | 2,147 | 2,521 | 1,643 |
| 2000 | 2,121 | 1,973 | 1,775 | 2,125 | 2,379 | 2,362 | 2,324 | 1,951 | 1,892 | 2,437 | 1,801 | 1,423 |
| 2001 | 1,489 | 1,309 | 1,976 | 1,638 | 1,619 | 1,644 | 1,682 | 2,014 | 2,024 | 2,079 | 2,063 | 1,485 |
| 2002 | 1,657 | 1,343 | 1,739 | 1,803 | 1,770 | 2,117 | 1,926 | 1,855 | 1,755 | 1,876 | 1,822 | 1,472 |
| 2003 | 1,427 | 1,806 | 1,992 | 1,946 | 1,783 | 2,209 | 1,974 | 2,133 | 2,392 | 2,186 | 1,850 | 1,312 |
| 2004 | 1,791 | 1,882 | 2,429 | 2,622 | 2,351 | 2,462 | 2,054 | 2,295 | 2,405 | 2,336 | 1,926 | 1,712 |
| 2005 | 1,849 | 1,768 | 1,930 | 1,568 | 1,679 | 1,788 | 1,400 | 1,517 | 1,533 | 1,171 | 1,259 | 991 |
| 2006 | 1,038 | 1,271 | 1,267 | 1,192 | 1,565 | 1,355 | 1,554 | 1,392 | 1,182 | 1,078 | 1,055 | 1,306 |
| 2007 | 1,266 | 1,342 | 1,542 | 1,358 | 1,285 | 1,607 | 1,161 | 1,065 | 1,549 | 1,550 | 1,516 | 1,374 |
| 2008 | 1,437 | 1,631 | 1,281 | 1,233 | 1,063 | 1,192 | 1,666 | 1,598 | 1,379 | 1,157 | 1,345 | 1,412 |
| 2009 | 1,386 | 1,168 | 1,428 | 1,650 | 1,899 | 1,652 | 1,368 | 1,506 | 1,523 | 1,530 | 1,607 | 1,377 |
| 2010 | 1,354 | 1,433 | 1,572 | 1,209 | 1,257 | 1,304 | 1,105 | 1,033 | 790 | 609 | 678 | 619 |
| 2011 | 1,193 | 871 | 954 | 1,088 | 1,107 | 1,072 | 1,340 | 1,169 | 989 | 1,201 | 689 | 796 |
| 2012 | 1,023 | 1,066 | 1,073 | 909 | 985 | 919 | 1,050 | 1,047 | 1,184 | 1,227 | 1,064 | 702 |
| 2013 | 1,183 | 1,384 | 989 | 939 | 1,022 | 950 | 1,041 | 992 | 699 | 929 | 1,010 | 929 |
| 2014 | 1,031 | 943 | 948 | 905 | 966 | 794 | 982 | 765 | 1,040 | 782 | 1,090 | 963 |
| 2015 | 1,048 | 828 | 965 | 1,131 | 1,086 | 889 | 1,143 | 904 | 1,008 | 1,018 | 1,068 | 1,230 |
| 2016 | 919 | 908 | 896 | 997 | 962 | 842 | 1,027 | 1,016 | 772 | 873 | 1,004 | 994 |
| 2017 | 1,287 | 1,387 | 1,282 | 1,252 | 931 | 1,088 | 1,189 | 989 | 843 | 929 | 1,203 | 977 |
| 2018 | 1,118 | 1,093 | 1,152 | 942 | 978 | 868 | 938 | 1,007 | 952 | 959 | 779 | 1,077 |
| 2019 | 993 | 1,066 | 1,018 | 1,103 | 1,150 | 942 | 1,149 | 987 | 911 | 995 | 921 | 958 |
| 2020 | 678 | 753 | 815 | 686 | 591 | 636 | 607 | 543 | 511 | 634 | 452 | 462 |
| 2021 | 504 | 642 | 668 | 702 | 681 | 474 | 420 | 517 | 445 | 471 | 567 | 449 |
| 2022 | 460 | 469 | 648 | 834 | 742 | 826 | 616 | 727 | 699 | 805 | 670 | 665 |
| 2023 | 705 | 787 | 606 | 588 | 730 | 613 | 659 | 522 | 662 | 735 | 675 | 850 |
| 2024 | 612 | |||||||||||
| - = No Data Reported; -- = Not Applicable; NA = Not Available; W = Withheld to avoid disclosure of individual company data. |
| Release Date: 3/29/2024 |
| Next Release Date: 4/30/2024 |
Referring Pages: