|
Download Data (XLS File) |
|
||||||||
|
||||||||
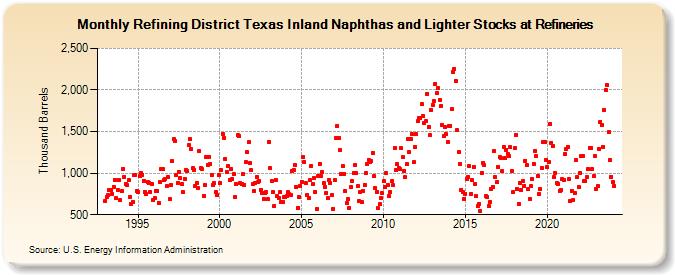
| Refining District Texas Inland Naphthas and Lighter Stocks at Refineries (Thousand Barrels) | ||||||||
| Year | Jan | Feb | Mar | Apr | May | Jun | Jul | Aug | Sep | Oct | Nov | Dec |
|---|---|---|---|---|---|---|---|---|---|---|---|---|
| 1993 | 669 | 711 | 732 | 796 | 802 | 753 | 839 | 921 | 696 | 801 | 916 | 674 |
| 1994 | 786 | 1,055 | 954 | 874 | 857 | 912 | 716 | 630 | 652 | 974 | 976 | 783 |
| 1995 | 772 | 962 | 1,000 | 982 | 906 | 778 | 747 | 891 | 886 | 775 | 864 | 680 |
| 1996 | 697 | 787 | 790 | 644 | 895 | 1,050 | 1,048 | 918 | 928 | 840 | 954 | 683 |
| 1997 | 858 | 1,143 | 1,407 | 1,386 | 974 | 884 | 1,014 | 936 | 868 | 772 | 933 | 1,038 |
| 1998 | 1,020 | 1,334 | 1,406 | 1,288 | 1,056 | 1,043 | 847 | 879 | 821 | 1,266 | 1,058 | 1,049 |
| 1999 | 728 | 858 | 1,198 | 1,101 | 1,194 | 1,112 | 978 | 861 | 878 | 772 | 743 | 979 |
| 2000 | 877 | 1,035 | 1,474 | 1,427 | 1,170 | 1,013 | 1,082 | 918 | 1,050 | 932 | 984 | 711 |
| 2001 | 869 | 1,455 | 1,445 | 880 | 871 | 988 | 858 | 1,130 | 1,251 | 1,369 | 1,121 | 1,032 |
| 2002 | 867 | 788 | 887 | 952 | 892 | 906 | 801 | 759 | 684 | 763 | 770 | 688 |
| 2003 | 1,376 | 1,057 | 909 | 768 | 608 | 921 | 725 | 705 | 768 | 648 | 647 | 709 |
| 2004 | 710 | 721 | 768 | 749 | 736 | 1,025 | 1,038 | 1,097 | 832 | 583 | 707 | 845 |
| 2005 | 898 | 1,191 | 1,131 | 877 | 736 | 697 | 923 | 1,087 | 864 | 945 | 776 | 569 |
| 2006 | 969 | 1,114 | 961 | 1,010 | 879 | 835 | 763 | 696 | 916 | 883 | 732 | 569 |
| 2007 | 912 | 1,424 | 1,568 | 1,420 | 1,274 | 995 | 1,083 | 992 | 782 | 642 | 688 | 584 |
| 2008 | 832 | 903 | 1,001 | 1,095 | 999 | 842 | 659 | 775 | 648 | 786 | 863 | 996 |
| 2009 | 1,108 | 1,161 | 1,135 | 1,146 | 1,248 | 964 | 816 | 777 | 575 | 624 | 700 | 758 |
| 2010 | 902 | 831 | 998 | 857 | 724 | 773 | 902 | 853 | 1,305 | 1,037 | 1,106 | 1,067 |
| 2011 | 1,049 | 1,297 | 1,190 | 1,031 | 950 | 1,105 | 1,406 | 1,249 | 1,407 | 1,465 | 1,128 | 1,320 |
| 2012 | 1,468 | 1,623 | 1,664 | 1,663 | 1,828 | 1,689 | 1,606 | 1,625 | 1,955 | 1,556 | 1,455 | 1,764 |
| 2013 | 1,824 | 1,867 | 2,075 | 1,961 | 2,023 | 1,879 | 1,810 | 1,583 | 1,449 | 1,554 | 1,465 | 1,378 |
| 2014 | 1,564 | 1,564 | 1,766 | 2,219 | 2,257 | 2,112 | 1,513 | 1,254 | 1,113 | 801 | 777 | 692 |
| 2015 | 755 | 929 | 957 | 1,085 | 752 | 914 | 1,079 | 869 | 723 | 606 | 632 | 540 |
| 2016 | 1,007 | 1,124 | 1,095 | 727 | 712 | 602 | 651 | 811 | 835 | 1,265 | 953 | 892 |
| 2017 | 1,079 | 1,190 | 1,184 | 1,020 | 1,317 | 1,181 | 1,284 | 1,234 | 1,206 | 1,311 | 1,023 | 773 |
| 2018 | 1,297 | 1,462 | 810 | 632 | 884 | 803 | 902 | 850 | 1,150 | 1,094 | 804 | 687 |
| 2019 | 841 | 934 | 1,112 | 1,270 | 1,205 | 968 | 750 | 804 | 1,067 | 1,374 | 1,370 | 1,163 |
| 2020 | 1,069 | 1,138 | 1,595 | 1,368 | 1,326 | 952 | 1,002 | 879 | 875 | 789 | 798 | 925 |
| 2021 | 921 | 1,228 | 1,295 | 1,316 | 927 | 670 | 791 | 679 | 759 | 1,152 | 948 | 831 |
| 2022 | 999 | 1,212 | 1,209 | 911 | 901 | 951 | 1,048 | 1,303 | 1,307 | 1,047 | 960 | 1,201 |
| 2023 | 808 | 843 | 1,292 | 1,617 | 1,582 | 1,318 | 1,759 | 2,002 | 2,055 | 1,490 | 1,158 | 955 |
| 2024 | 888 | |||||||||||
| - = No Data Reported; -- = Not Applicable; NA = Not Available; W = Withheld to avoid disclosure of individual company data. |
| Release Date: 3/29/2024 |
| Next Release Date: 4/30/2024 |
Referring Pages: