|
Download Data (XLS File) |
|
||||||||
|
||||||||
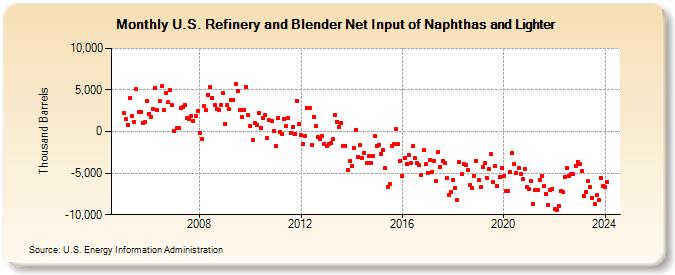
| U.S. Refinery and Blender Net Input of Naphthas and Lighter (Thousand Barrels) | ||||||||
| Year | Jan | Feb | Mar | Apr | May | Jun | Jul | Aug | Sep | Oct | Nov | Dec |
|---|---|---|---|---|---|---|---|---|---|---|---|---|
| 2005 | 2,247 | 1,472 | 824 | 4,066 | 1,827 | 1,197 | 5,098 | 2,359 | 2,340 | 1,029 | 1,165 | 3,663 |
| 2006 | 2,162 | 1,718 | 2,690 | 5,217 | 2,580 | 3,664 | 5,424 | 2,583 | 4,689 | 3,520 | 4,990 | 3,133 |
| 2007 | 119 | 476 | 478 | 2,823 | 2,918 | 3,168 | 1,662 | 1,539 | 1,831 | 1,279 | 1,929 | 2,507 |
| 2008 | -162 | -933 | 3,066 | 2,542 | 4,417 | 5,305 | 4,068 | 3,161 | 2,678 | 2,568 | 3,183 | 4,639 |
| 2009 | 924 | 3,221 | 2,710 | 3,829 | 3,787 | 5,747 | 4,935 | 2,632 | 1,808 | 2,635 | 5,417 | 1,975 |
| 2010 | 628 | -970 | 1,014 | 830 | 2,227 | 479 | 1,600 | 1,963 | -821 | 1,345 | 1,289 | 116 |
| 2011 | -1,766 | 1,636 | -70 | -288 | 1,481 | 652 | 1,641 | -192 | 551 | -268 | 3,617 | 868 |
| 2012 | -427 | -1,486 | -537 | 2,798 | 2,772 | -1,637 | 1,763 | 689 | -708 | -942 | -490 | -1,448 |
| 2013 | -1,693 | -1,515 | -1,434 | -948 | 2,008 | 1,192 | 606 | 1,036 | -1,718 | -1,700 | -4,672 | -3,523 |
| 2014 | -4,143 | -2,025 | 193 | -3,011 | -1,654 | -3,158 | -2,541 | -3,757 | -2,964 | -3,742 | -2,891 | -582 |
| 2015 | -1,697 | -1,566 | -2,649 | -2,199 | -4,356 | -6,630 | -6,364 | -1,747 | -1,498 | 262 | -1,530 | -3,485 |
| 2016 | -5,362 | -3,176 | -3,885 | -2,874 | -3,769 | -1,763 | -3,187 | -3,798 | -4,078 | -5,259 | -2,257 | -3,914 |
| 2017 | -4,933 | -3,462 | -4,828 | -3,559 | -5,961 | -2,418 | -4,215 | -3,503 | -3,744 | -5,645 | -7,620 | -7,215 |
| 2018 | -5,767 | -6,728 | -8,189 | -3,622 | -5,110 | -3,851 | -4,052 | -4,681 | -6,410 | -6,840 | -5,326 | -3,508 |
| 2019 | -5,779 | -6,724 | -4,255 | -3,745 | -5,569 | -4,557 | -2,648 | -6,096 | -4,171 | -6,502 | -5,506 | -4,343 |
| 2020 | -5,315 | -7,118 | -7,155 | -4,867 | -2,547 | -3,940 | -5,008 | -4,420 | -5,096 | -5,757 | -4,552 | -6,657 |
| 2021 | -6,934 | -5,925 | -8,664 | -7,065 | -7,084 | -5,776 | -5,394 | -6,522 | -7,479 | -8,773 | -7,023 | -6,848 |
| 2022 | -9,346 | -9,485 | -8,926 | -7,162 | -7,215 | -5,417 | -4,346 | -5,295 | -5,162 | -5,080 | -4,091 | -3,602 |
| 2023 | -3,923 | -4,719 | -7,729 | -7,272 | -5,999 | -6,613 | -7,968 | -8,728 | -7,613 | -8,267 | -5,582 | -6,537 |
| 2024 | -6,619 | |||||||||||
| - = No Data Reported; -- = Not Applicable; NA = Not Available; W = Withheld to avoid disclosure of individual company data. |
| Release Date: 3/29/2024 |
| Next Release Date: 4/30/2024 |