|
Download Data (XLS File) |
|
||||||||
|
||||||||
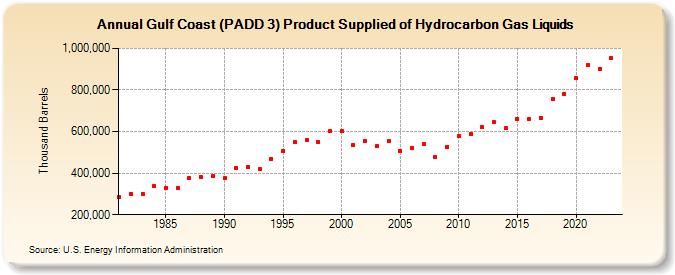
| Gulf Coast (PADD 3) Product Supplied of Hydrocarbon Gas Liquids (Thousand Barrels) | ||||||||
| Decade | Year-0 | Year-1 | Year-2 | Year-3 | Year-4 | Year-5 | Year-6 | Year-7 | Year-8 | Year-9 |
|---|---|---|---|---|---|---|---|---|---|---|
| 1980's | 284,630 | 302,004 | 300,790 | 338,124 | 330,865 | 329,102 | 377,270 | 381,460 | 384,781 | |
| 1990's | 374,201 | 424,775 | 428,244 | 418,366 | 469,089 | 505,336 | 549,391 | 561,282 | 551,569 | 601,845 |
| 2000's | 601,684 | 535,128 | 553,501 | 529,017 | 552,197 | 508,372 | 518,559 | 539,583 | 475,677 | 527,278 |
| 2010's | 576,968 | 588,192 | 619,996 | 644,797 | 614,953 | 662,452 | 662,742 | 665,649 | 756,519 | 782,320 |
| 2020's | 855,330 | 922,350 | 901,683 | 951,762 |
| - = No Data Reported; -- = Not Applicable; NA = Not Available; W = Withheld to avoid disclosure of individual company data. |
| Release Date: 3/29/2024 |
| Next Release Date: 8/30/2024 |