|
Download Data (XLS File) |
|
||||||||
|
||||||||
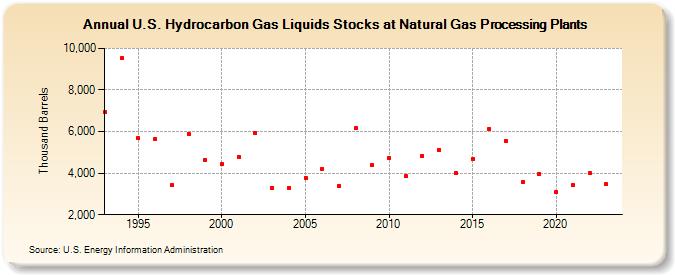
| U.S. Hydrocarbon Gas Liquids Stocks at Natural Gas Processing Plants (Thousand Barrels) | ||||||||
| Decade | Year-0 | Year-1 | Year-2 | Year-3 | Year-4 | Year-5 | Year-6 | Year-7 | Year-8 | Year-9 |
|---|---|---|---|---|---|---|---|---|---|---|
| 1990's | 6,929 | 9,537 | 5,685 | 5,657 | 3,428 | 5,873 | 4,647 | |||
| 2000's | 4,437 | 4,790 | 5,920 | 3,305 | 3,286 | 3,786 | 4,214 | 3,382 | 6,154 | 4,387 |
| 2010's | 4,738 | 3,841 | 4,828 | 5,118 | 4,005 | 4,685 | 6,136 | 5,552 | 3,555 | 3,975 |
| 2020's | 3,103 | 3,410 | 3,985 | 3,467 |
| - = No Data Reported; -- = Not Applicable; NA = Not Available; W = Withheld to avoid disclosure of individual company data. |
| Release Date: 3/29/2024 |
| Next Release Date: 8/30/2024 |