|
Download Data (XLS File) |
|
||||||||
|
||||||||
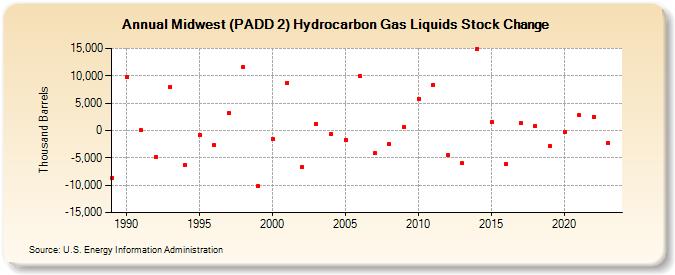
| Midwest (PADD 2) Hydrocarbon Gas Liquids Stock Change (Thousand Barrels) | ||||||||
| Decade | Year-0 | Year-1 | Year-2 | Year-3 | Year-4 | Year-5 | Year-6 | Year-7 | Year-8 | Year-9 |
|---|---|---|---|---|---|---|---|---|---|---|
| 1980's | -8,641 | |||||||||
| 1990's | 9,793 | 0 | -4,827 | 7,997 | -6,353 | -841 | -2,701 | 3,107 | 11,603 | -10,154 |
| 2000's | -1,523 | 8,727 | -6,711 | 1,104 | -602 | -1,668 | 9,937 | -4,181 | -2,522 | 593 |
| 2010's | 5,758 | 8,327 | -4,496 | -6,015 | 14,873 | 1,513 | -6,127 | 1,317 | 845 | -2,800 |
| 2020's | -189 | 2,801 | 2,532 | -2,321 |
| - = No Data Reported; -- = Not Applicable; NA = Not Available; W = Withheld to avoid disclosure of individual company data. |
| Release Date: 3/29/2024 |
| Next Release Date: 8/30/2024 |