|
Download Data (XLS File) |
|
||||||||
|
||||||||
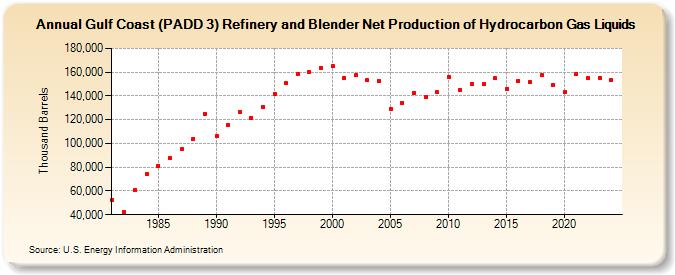
| Gulf Coast (PADD 3) Refinery and Blender Net Production of Hydrocarbon Gas Liquids (Thousand Barrels) | ||||||||
| Decade | Year-0 | Year-1 | Year-2 | Year-3 | Year-4 | Year-5 | Year-6 | Year-7 | Year-8 | Year-9 |
|---|---|---|---|---|---|---|---|---|---|---|
| 1980's | 52,383 | 42,359 | 61,090 | 73,953 | 81,268 | 87,619 | 95,025 | 104,059 | 125,110 | |
| 1990's | 106,255 | 115,719 | 126,249 | 121,643 | 131,074 | 141,608 | 150,816 | 158,438 | 160,276 | 163,844 |
| 2000's | 165,031 | 155,164 | 157,187 | 153,333 | 152,726 | 129,344 | 134,434 | 142,660 | 138,736 | 143,002 |
| 2010's | 156,304 | 144,799 | 150,143 | 149,950 | 155,019 | 146,127 | 152,797 | 151,982 | 157,370 | 149,156 |
| 2020's | 143,063 | 158,759 | 154,876 | 155,471 |
| - = No Data Reported; -- = Not Applicable; NA = Not Available; W = Withheld to avoid disclosure of individual company data. |
| Release Date: 3/29/2024 |
| Next Release Date: 8/30/2024 |