|
Download Data (XLS File) |
|
||||||||
|
||||||||
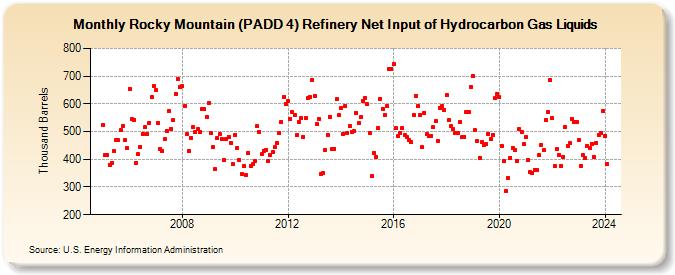
| Rocky Mountain (PADD 4) Refinery Net Input of Hydrocarbon Gas Liquids (Thousand Barrels) | ||||||||
| Year | Jan | Feb | Mar | Apr | May | Jun | Jul | Aug | Sep | Oct | Nov | Dec |
|---|---|---|---|---|---|---|---|---|---|---|---|---|
| 2005 | 523 | 417 | 416 | 381 | 388 | 429 | 469 | 468 | 505 | 519 | 469 | 439 |
| 2006 | 655 | 546 | 543 | 387 | 418 | 446 | 490 | 515 | 492 | 532 | 623 | 666 |
| 2007 | 650 | 532 | 437 | 431 | 472 | 503 | 574 | 511 | 541 | 637 | 689 | 662 |
| 2008 | 663 | 592 | 491 | 430 | 477 | 516 | 497 | 510 | 497 | 580 | 580 | 552 |
| 2009 | 603 | 495 | 443 | 364 | 477 | 491 | 472 | 397 | 472 | 481 | 459 | 382 |
| 2010 | 488 | 441 | 399 | 348 | 376 | 344 | 424 | 375 | 382 | 393 | 519 | 499 |
| 2011 | 419 | 431 | 435 | 395 | 416 | 427 | 443 | 458 | 495 | 534 | 626 | 600 |
| 2012 | 609 | 547 | 569 | 559 | 489 | 534 | 548 | 481 | 549 | 620 | 624 | 686 |
| 2013 | 628 | 526 | 547 | 347 | 350 | 432 | 488 | 554 | 437 | 438 | 616 | 559 |
| 2014 | 585 | 491 | 592 | 496 | 520 | 500 | 501 | 568 | 530 | 551 | 610 | 622 |
| 2015 | 598 | 494 | 339 | 424 | 409 | 512 | 619 | 582 | 560 | 593 | 724 | 727 |
| 2016 | 743 | 512 | 483 | 496 | 512 | 489 | 479 | 469 | 462 | 559 | 628 | 591 |
| 2017 | 559 | 443 | 568 | 490 | 483 | 485 | 515 | 537 | 466 | 586 | 592 | 578 |
| 2018 | 631 | 540 | 519 | 508 | 495 | 495 | 535 | 479 | 482 | 571 | 571 | 662 |
| 2019 | 700 | 504 | 466 | 406 | 463 | 451 | 455 | 492 | 473 | 487 | 620 | 637 |
| 2020 | 623 | 449 | 393 | 286 | 334 | 406 | 441 | 435 | 392 | 509 | 500 | 454 |
| 2021 | 480 | 398 | 353 | 351 | 363 | 361 | 415 | 452 | 433 | 542 | 571 | 686 |
| 2022 | 548 | 374 | 436 | 416 | 376 | 408 | 515 | 449 | 457 | 547 | 536 | 535 |
| 2023 | 470 | 377 | 414 | 403 | 448 | 440 | 456 | 410 | 460 | 488 | 494 | 573 |
| 2024 | 485 | |||||||||||
| - = No Data Reported; -- = Not Applicable; NA = Not Available; W = Withheld to avoid disclosure of individual company data. |
| Release Date: 3/29/2024 |
| Next Release Date: 4/30/2024 |
Referring Pages: