|
Download Data (XLS File) |
|
||||||||
|
||||||||
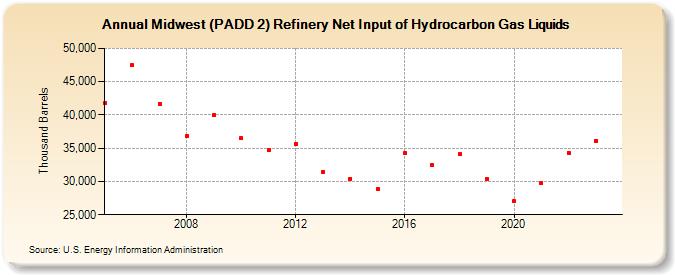
| Midwest (PADD 2) Refinery Net Input of Hydrocarbon Gas Liquids (Thousand Barrels) | ||||||||
| Decade | Year-0 | Year-1 | Year-2 | Year-3 | Year-4 | Year-5 | Year-6 | Year-7 | Year-8 | Year-9 |
|---|---|---|---|---|---|---|---|---|---|---|
| 2000's | 41,729 | 47,431 | 41,647 | 36,833 | 40,016 | |||||
| 2010's | 36,466 | 34,672 | 35,646 | 31,435 | 30,414 | 28,855 | 34,305 | 32,406 | 34,067 | 30,436 |
| 2020's | 27,016 | 29,744 | 34,326 | 36,137 |
| - = No Data Reported; -- = Not Applicable; NA = Not Available; W = Withheld to avoid disclosure of individual company data. |
| Release Date: 3/29/2024 |
| Next Release Date: 8/30/2024 |
Referring Pages: