|
Download Data (XLS File) |
|
||||||||
|
||||||||
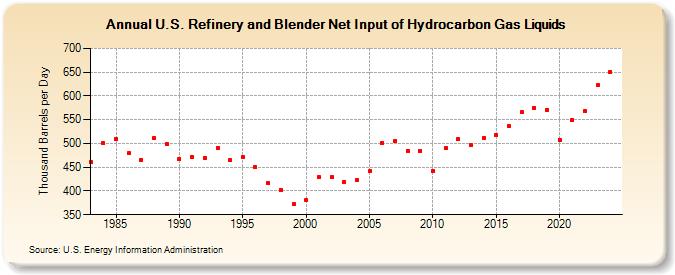
| U.S. Refinery and Blender Net Input of Hydrocarbon Gas Liquids (Thousand Barrels per Day) | ||||||||
| Decade | Year-0 | Year-1 | Year-2 | Year-3 | Year-4 | Year-5 | Year-6 | Year-7 | Year-8 | Year-9 |
|---|---|---|---|---|---|---|---|---|---|---|
| 1980's | 460 | 500 | 509 | 479 | 466 | 511 | 499 | |||
| 1990's | 467 | 472 | 469 | 491 | 465 | 471 | 450 | 416 | 403 | 372 |
| 2000's | 380 | 429 | 429 | 419 | 422 | 441 | 501 | 505 | 485 | 485 |
| 2010's | 442 | 490 | 509 | 496 | 511 | 517 | 536 | 566 | 575 | 571 |
| 2020's | 508 | 549 | 568 | 622 |
| - = No Data Reported; -- = Not Applicable; NA = Not Available; W = Withheld to avoid disclosure of individual company data. |
| Release Date: 8/30/2024 |
| Next Release Date: 8/29/2025 |