|
Download Data (XLS File) |
|
||||||||
|
||||||||
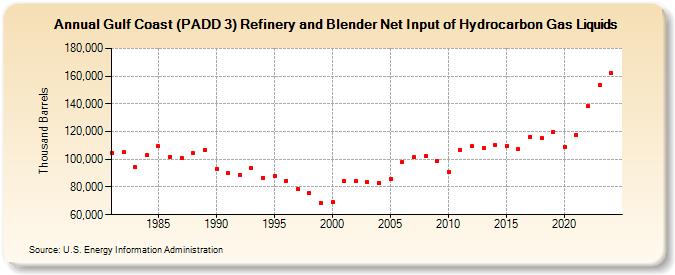
| Gulf Coast (PADD 3) Refinery and Blender Net Input of Hydrocarbon Gas Liquids (Thousand Barrels) | ||||||||
| Decade | Year-0 | Year-1 | Year-2 | Year-3 | Year-4 | Year-5 | Year-6 | Year-7 | Year-8 | Year-9 |
|---|---|---|---|---|---|---|---|---|---|---|
| 1980's | 104,529 | 105,009 | 94,219 | 103,038 | 109,346 | 101,825 | 101,121 | 104,282 | 106,812 | |
| 1990's | 93,318 | 89,924 | 88,831 | 93,869 | 86,670 | 87,717 | 84,378 | 78,554 | 75,462 | 68,316 |
| 2000's | 69,115 | 84,532 | 83,992 | 83,863 | 83,144 | 85,924 | 97,950 | 101,290 | 102,279 | 98,838 |
| 2010's | 90,975 | 106,751 | 109,476 | 108,476 | 110,386 | 109,729 | 107,069 | 116,262 | 115,438 | 119,987 |
| 2020's | 108,768 | 117,336 | 138,202 | 153,600 |
| - = No Data Reported; -- = Not Applicable; NA = Not Available; W = Withheld to avoid disclosure of individual company data. |
| Release Date: 3/29/2024 |
| Next Release Date: 8/30/2024 |