|
Download Data (XLS File) |
|
||||||||
|
||||||||
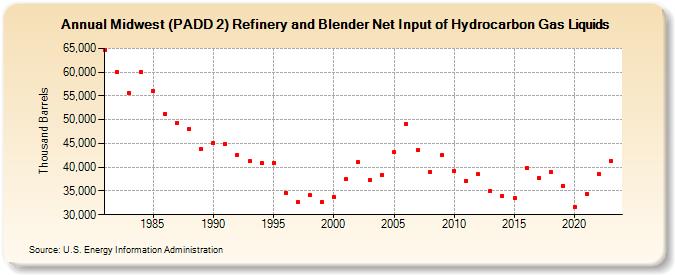
| Midwest (PADD 2) Refinery and Blender Net Input of Hydrocarbon Gas Liquids (Thousand Barrels) | ||||||||
| Decade | Year-0 | Year-1 | Year-2 | Year-3 | Year-4 | Year-5 | Year-6 | Year-7 | Year-8 | Year-9 |
|---|---|---|---|---|---|---|---|---|---|---|
| 1980's | 64,745 | 60,015 | 55,657 | 60,034 | 56,080 | 51,265 | 49,371 | 48,076 | 43,760 | |
| 1990's | 45,080 | 44,916 | 42,665 | 41,235 | 40,881 | 40,975 | 34,627 | 32,684 | 34,119 | 32,749 |
| 2000's | 33,741 | 37,509 | 41,074 | 37,333 | 38,428 | 43,141 | 49,121 | 43,692 | 39,044 | 42,533 |
| 2010's | 39,223 | 37,192 | 38,476 | 34,959 | 34,038 | 33,505 | 39,838 | 37,719 | 38,986 | 36,124 |
| 2020's | 31,696 | 34,418 | 38,568 | 41,325 |
| - = No Data Reported; -- = Not Applicable; NA = Not Available; W = Withheld to avoid disclosure of individual company data. |
| Release Date: 3/29/2024 |
| Next Release Date: 8/30/2024 |