|
Download Data (XLS File) |
|
||||||||
|
||||||||
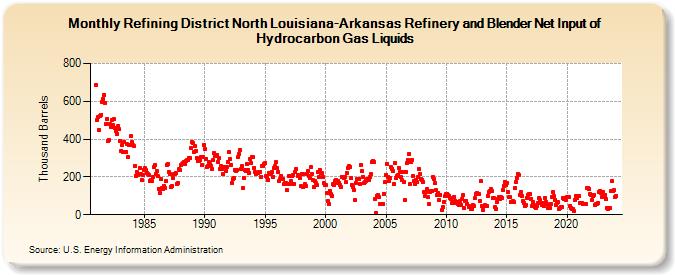
| Refining District North Louisiana-Arkansas Refinery and Blender Net Input of Hydrocarbon Gas Liquids (Thousand Barrels) | ||||||||
| Year | Jan | Feb | Mar | Apr | May | Jun | Jul | Aug | Sep | Oct | Nov | Dec |
|---|---|---|---|---|---|---|---|---|---|---|---|---|
| 1981 | 686 | 503 | 519 | 449 | 521 | 529 | 594 | 614 | 634 | 589 | 482 | 508 |
| 1982 | 391 | 395 | 478 | 462 | 502 | 472 | 504 | 458 | 445 | 429 | 470 | 451 |
| 1983 | 390 | 336 | 371 | 330 | 387 | 332 | 331 | 372 | 304 | 369 | 415 | 383 |
| 1984 | 367 | 365 | 257 | 206 | 227 | 209 | 218 | 245 | 216 | 185 | 210 | 238 |
| 1985 | 248 | 235 | 223 | 217 | 209 | 179 | 183 | 180 | 200 | 251 | 262 | 216 |
| 1986 | 232 | 203 | 138 | 116 | 187 | 141 | 136 | 151 | 142 | 176 | 262 | 266 |
| 1987 | 225 | 216 | 149 | 154 | 192 | 215 | 214 | 223 | 165 | 169 | 240 | 235 |
| 1988 | 261 | 266 | 272 | 280 | 270 | 283 | 287 | 289 | 298 | 301 | 351 | 383 |
| 1989 | 380 | 333 | 362 | 339 | 301 | 282 | 284 | 290 | 306 | 262 | 306 | 371 |
| 1990 | 345 | 295 | 253 | 259 | 278 | 268 | 260 | 244 | 288 | 326 | 312 | 311 |
| 1991 | 317 | 279 | 300 | 242 | 258 | 243 | 218 | 251 | 250 | 233 | 252 | 279 |
| 1992 | 330 | 294 | 264 | 170 | 188 | 194 | 239 | 232 | 236 | 303 | 323 | 343 |
| 1993 | 243 | 256 | 141 | 192 | 237 | 233 | 267 | 239 | 223 | 295 | 274 | 306 |
| 1994 | 303 | 249 | 227 | 218 | 222 | 220 | 225 | 227 | 202 | 259 | 260 | 269 |
| 1995 | 274 | 206 | 201 | 186 | 220 | 216 | 216 | 224 | 201 | 246 | 257 | 277 |
| 1996 | 247 | 226 | 179 | 187 | 205 | 188 | 188 | 163 | 167 | 169 | 129 | 160 |
| 1997 | 203 | 177 | 163 | 206 | 209 | 163 | 227 | 242 | 205 | 208 | 196 | 150 |
| 1998 | 218 | 217 | 144 | 161 | 154 | 216 | 229 | 206 | 193 | 250 | 215 | 185 |
| 1999 | 144 | 176 | 169 | 155 | 226 | 198 | 239 | 219 | 219 | 202 | 168 | 155 |
| 2000 | 155 | 114 | 70 | 58 | 128 | 109 | 97 | 161 | 159 | 177 | 186 | 168 |
| 2001 | 179 | 167 | 157 | 149 | 200 | 198 | 196 | 201 | 171 | 220 | 246 | 256 |
| 2002 | 255 | 195 | 158 | 148 | 133 | 78 | 169 | 188 | 190 | 189 | 164 | 264 |
| 2003 | 229 | 201 | 166 | 174 | 178 | 188 | 184 | 185 | 201 | 216 | 278 | 285 |
| 2004 | 278 | 83 | 11 | 100 | 102 | 95 | 56 | 57 | 58 | 58 | 112 | 171 |
| 2005 | 212 | 269 | 201 | 177 | 193 | 252 | 244 | 232 | 164 | 271 | 193 | 203 |
| 2006 | 212 | 247 | 227 | 199 | 182 | 227 | 172 | 77 | 228 | 275 | 290 | 322 |
| 2007 | 161 | 280 | 290 | 207 | 179 | 165 | 183 | 173 | 200 | 243 | 215 | 191 |
| 2008 | 186 | 172 | 121 | 100 | 119 | 136 | 93 | 55 | 121 | 126 | 126 | 199 |
| 2009 | 187 | 166 | 131 | 106 | 115 | 78 | 106 | 24 | 40 | 69 | 97 | |
| 2010 | 109 | 111 | 103 | 101 | 89 | 82 | 60 | 65 | 96 | 74 | 63 | 68 |
| 2011 | 57 | 49 | 72 | 54 | 85 | 102 | 35 | 73 | 73 | 57 | 45 | 42 |
| 2012 | 30 | 30 | 50 | 46 | 86 | 109 | 115 | 111 | 112 | 73 | 176 | 46 |
| 2013 | 26 | 48 | 49 | 45 | 47 | 101 | 121 | 128 | 136 | 126 | 90 | 87 |
| 2014 | 41 | 32 | 66 | 82 | 92 | 83 | 96 | 91 | 133 | 152 | 175 | 156 |
| 2015 | 169 | 122 | 92 | 92 | 67 | 69 | 72 | 65 | 140 | 173 | 196 | 217 |
| 2016 | 210 | 106 | 119 | 100 | 73 | 64 | 47 | 54 | 89 | 104 | 108 | 110 |
| 2017 | 85 | 48 | 66 | 52 | 41 | 38 | 45 | 61 | 91 | 76 | 61 | 51 |
| 2018 | 60 | 47 | 90 | 69 | 59 | 33 | 45 | 37 | 59 | 94 | 118 | 99 |
| 2019 | 80 | 53 | 62 | 66 | 28 | 35 | 40 | 43 | 90 | 85 | 88 | 79 |
| 2020 | 94 | 94 | 92 | 46 | 38 | 32 | 32 | 19 | 78 | 101 | 86 | 99 |
| 2021 | 98 | 64 | 63 | 62 | 59 | 58 | 56 | 55 | 143 | 142 | 138 | 111 |
| 2022 | 102 | 79 | 97 | 104 | 54 | 59 | 58 | 62 | 119 | 128 | 116 | 95 |
| 2023 | 119 | 95 | 106 | 81 | 33 | 29 | 35 | 34 | 127 | 176 | 128 | 129 |
| 2024 | 95 | |||||||||||
| - = No Data Reported; -- = Not Applicable; NA = Not Available; W = Withheld to avoid disclosure of individual company data. |
| Release Date: 3/29/2024 |
| Next Release Date: 4/30/2024 |