|
Download Data (XLS File) |
|
||||||||
|
||||||||
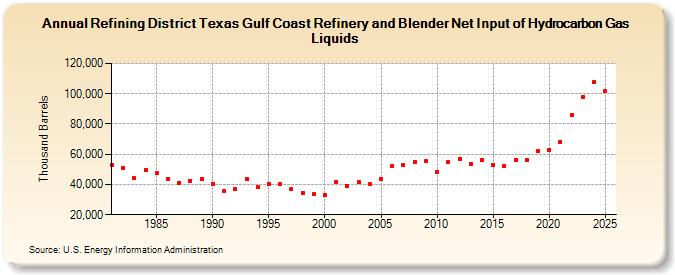
| Refining District Texas Gulf Coast Refinery and Blender Net Input of Hydrocarbon Gas Liquids (Thousand Barrels) | ||||||||
| Decade | Year-0 | Year-1 | Year-2 | Year-3 | Year-4 | Year-5 | Year-6 | Year-7 | Year-8 | Year-9 |
|---|---|---|---|---|---|---|---|---|---|---|
| 1980's | 53,084 | 51,030 | 44,014 | 49,652 | 47,332 | 43,466 | 41,283 | 42,338 | 43,642 | |
| 1990's | 40,507 | 35,676 | 36,917 | 43,923 | 38,441 | 40,058 | 40,089 | 36,731 | 34,527 | 33,484 |
| 2000's | 33,018 | 41,840 | 39,034 | 41,417 | 40,298 | 43,935 | 52,225 | 52,774 | 55,164 | 55,222 |
| 2010's | 48,411 | 54,997 | 56,986 | 53,786 | 56,308 | 53,066 | 52,398 | 56,462 | 56,300 | 62,114 |
| 2020's | 62,598 | 68,346 | 85,932 | 97,618 |
| - = No Data Reported; -- = Not Applicable; NA = Not Available; W = Withheld to avoid disclosure of individual company data. |
| Release Date: 3/29/2024 |
| Next Release Date: 8/30/2024 |