|
Download Data (XLS File) |
|
||||||||
|
||||||||
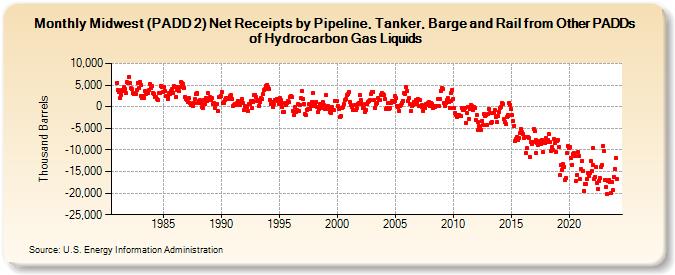
| Midwest (PADD 2) Net Receipts by Pipeline, Tanker, Barge and Rail from Other PADDs of Hydrocarbon Gas Liquids (Thousand Barrels) | ||||||||
| Year | Jan | Feb | Mar | Apr | May | Jun | Jul | Aug | Sep | Oct | Nov | Dec |
|---|---|---|---|---|---|---|---|---|---|---|---|---|
| 1981 | 5,598 | 3,826 | 3,340 | 2,030 | 2,738 | 3,892 | 3,663 | 4,546 | 4,176 | 3,173 | 5,616 | 5,526 |
| 1982 | 6,909 | 5,390 | 4,225 | 4,103 | 3,191 | 3,046 | 2,939 | 2,903 | 3,768 | 5,581 | 4,244 | 5,711 |
| 1983 | 5,068 | 2,563 | 2,098 | 2,530 | 2,025 | 3,580 | 2,995 | 3,342 | 3,053 | 3,965 | 5,159 | 4,406 |
| 1984 | 4,683 | 3,209 | 3,004 | 2,145 | 2,339 | 1,821 | 1,629 | 3,155 | 3,194 | 4,694 | 4,473 | 3,301 |
| 1985 | 4,443 | 3,744 | 2,367 | 2,565 | 2,273 | 1,845 | 3,187 | 2,938 | 3,577 | 4,126 | 3,265 | 4,727 |
| 1986 | 4,486 | 2,194 | 3,942 | 4,616 | 3,560 | 4,480 | 5,732 | 5,455 | 5,309 | 4,280 | 2,278 | 1,775 |
| 1987 | 1,562 | 1,132 | 1,986 | 815 | 301 | 410 | 124 | 912 | 1,747 | 2,957 | 3,087 | 2,917 |
| 1988 | 935 | 1,301 | 1,466 | 887 | -70 | -321 | 1,494 | 661 | 2,107 | 1,252 | 3,064 | 1,526 |
| 1989 | 2,142 | 1,498 | 1,936 | 661 | 767 | -285 | 686 | 532 | -899 | 2,134 | 2,315 | 2,542 |
| 1990 | 3,406 | 768 | 891 | 1,000 | 1,513 | 2,120 | 1,788 | 1,818 | 2,029 | 2,526 | 2,620 | 1,748 |
| 1991 | 263 | 314 | 680 | 429 | 796 | 1,269 | 941 | 426 | 1,105 | 1,745 | 872 | -860 |
| 1992 | 212 | -45 | -25 | -1,094 | 656 | 557 | 1,213 | -326 | 1,201 | 1,277 | 2,601 | 2,811 |
| 1993 | 2,207 | 1,423 | 1,509 | 201 | 1,015 | 1,970 | 1,729 | 2,850 | 3,888 | 4,147 | 4,887 | 5,103 |
| 1994 | 4,456 | 4,138 | 1,605 | 671 | 1,191 | -1 | 548 | 1,586 | 1,639 | 1,757 | 1,390 | 697 |
| 1995 | 1,967 | 1,543 | 907 | -174 | -1,141 | -1,193 | 833 | 404 | 899 | 1,292 | 1,040 | 2,181 |
| 1996 | 2,519 | 2,129 | -1,002 | -2,021 | -161 | -1,200 | -850 | 523 | -1,098 | 476 | 1,920 | 3,673 |
| 1997 | 1,884 | 662 | -1,625 | -2,010 | -698 | -617 | 509 | 589 | -636 | 173 | 1,148 | 3,145 |
| 1998 | 265 | 645 | 1,095 | -20 | -1,273 | -481 | 528 | -282 | 537 | 1,006 | 289 | -639 |
| 1999 | 2,671 | -450 | 174 | -450 | -1,226 | -1,438 | -18 | -721 | -828 | 1,407 | 1,428 | 1,233 |
| 2000 | 203 | -445 | -289 | -2,286 | -2,128 | -259 | -43 | 517 | 1,581 | 1,728 | 2,696 | 2,910 |
| 2001 | 3,418 | 1,154 | 311 | -102 | -729 | -858 | 350 | -709 | -383 | 712 | 877 | 2,636 |
| 2002 | 1,559 | 509 | -374 | -398 | -1,243 | -872 | 567 | 560 | 1,194 | 1,211 | 1,521 | 2,882 |
| 2003 | 3,391 | 3,493 | 1,601 | -191 | 544 | 861 | 1,920 | 1,629 | 1,597 | 2,782 | 3,071 | 2,898 |
| 2004 | 2,793 | 1,704 | -534 | -214 | 782 | -649 | -225 | 863 | 1,210 | 1,209 | 1,093 | 1,408 |
| 2005 | 2,406 | 1,902 | 95 | -5 | -990 | 244 | 377 | 871 | 1,399 | 3,282 | 3,035 | 4,606 |
| 2006 | 3,746 | 1,202 | 1,919 | 663 | -922 | 84 | 480 | 1,096 | 542 | 1,515 | 1,193 | 1,781 |
| 2007 | 244 | 1,662 | 139 | -42 | 315 | -921 | 40 | -357 | 609 | 422 | 806 | 1,052 |
| 2008 | 187 | 904 | 626 | -197 | 77 | 22 | 234 | 67 | 1,740 | 62 | 1,838 | 3,731 |
| 2009 | 4,265 | 4,186 | 859 | 251 | 955 | 1,438 | 1,905 | 1,139 | -291 | 1,294 | 3,098 | 3,867 |
| 2010 | 1,792 | -406 | -1,346 | -1,865 | -2,445 | -2,208 | -1,870 | -2,162 | -2,212 | -277 | -753 | -805 |
| 2011 | -371 | -3,660 | -1,530 | -38 | -2,814 | -643 | 483 | 121 | -722 | -156 | -200 | -3,006 |
| 2012 | -1,888 | -3,529 | -5,423 | -4,573 | -4,676 | -5,394 | -3,208 | -4,206 | -1,720 | -2,053 | -2,010 | -4,316 |
| 2013 | -1,634 | -451 | -1,410 | -3,671 | -3,545 | -1,453 | -1,375 | -779 | -2,293 | -3,639 | -2,078 | -1,117 |
| 2014 | -385 | -44 | 888 | 546 | -2,906 | -3,543 | -4,025 | -2,422 | -1,917 | -2,144 | 871 | 453 |
| 2015 | -607 | -1,874 | -3,307 | -4,378 | -7,954 | -7,497 | -6,901 | -7,726 | -7,211 | -6,134 | -5,202 | -5,956 |
| 2016 | -6,292 | -7,341 | -7,072 | -10,814 | -9,627 | -6,928 | -7,174 | -11,558 | -8,259 | -8,666 | -8,097 | -5,202 |
| 2017 | -5,694 | -7,723 | -10,820 | -8,343 | -8,935 | -8,355 | -8,046 | -8,709 | -7,641 | -10,583 | -8,190 | -8,465 |
| 2018 | -7,235 | -8,197 | -7,655 | -6,407 | -8,144 | -10,298 | -9,253 | -9,946 | -7,486 | -8,386 | -10,431 | -7,912 |
| 2019 | -7,594 | -9,394 | -15,888 | -13,528 | -14,616 | -13,871 | -13,375 | -13,852 | -16,979 | -16,528 | -10,756 | -9,180 |
| 2020 | -9,624 | -9,369 | -11,967 | -13,384 | -10,934 | -10,643 | -11,377 | -17,178 | -15,795 | -10,547 | -11,378 | -16,748 |
| 2021 | -14,485 | -12,538 | -14,814 | -19,537 | -17,865 | -17,861 | -16,747 | -15,343 | -16,088 | -15,337 | -12,620 | -14,815 |
| 2022 | -13,407 | -9,537 | -16,691 | -16,183 | -13,997 | -17,598 | -18,934 | -17,186 | -16,531 | -13,931 | -13,503 | -8,998 |
| 2023 | -10,229 | -16,887 | -18,580 | -20,273 | -17,197 | -16,945 | -17,435 | -20,017 | -17,395 | -19,370 | -16,243 | -14,409 |
| 2024 | -11,763 | |||||||||||
| - = No Data Reported; -- = Not Applicable; NA = Not Available; W = Withheld to avoid disclosure of individual company data. |
| Release Date: 3/29/2024 |
| Next Release Date: 4/30/2024 |