|
Download Data (XLS File) |
|
||||||||
|
||||||||
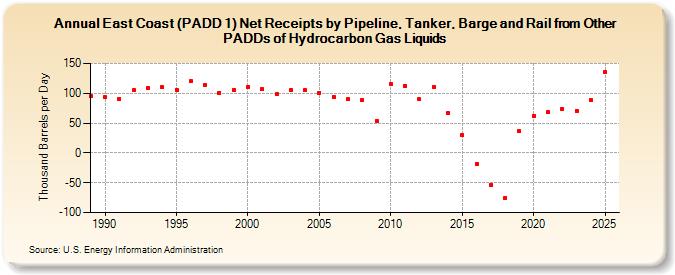
| East Coast (PADD 1) Net Receipts by Pipeline, Tanker, Barge and Rail from Other PADDs of Hydrocarbon Gas Liquids (Thousand Barrels per Day) | ||||||||
| Decade | Year-0 | Year-1 | Year-2 | Year-3 | Year-4 | Year-5 | Year-6 | Year-7 | Year-8 | Year-9 |
|---|---|---|---|---|---|---|---|---|---|---|
| 1980's | 95 | |||||||||
| 1990's | 93 | 91 | 105 | 109 | 110 | 106 | 120 | 114 | 101 | 106 |
| 2000's | 111 | 107 | 98 | 105 | 105 | 101 | 94 | 90 | 88 | 54 |
| 2010's | 115 | 112 | 90 | 111 | 67 | 30 | -18 | -53 | -75 | 36 |
| 2020's | 62 | 68 | 74 | 61 |
| - = No Data Reported; -- = Not Applicable; NA = Not Available; W = Withheld to avoid disclosure of individual company data. |
| Release Date: 3/29/2024 |
| Next Release Date: 8/30/2024 |