|
Download Data (XLS File) |
|
||||||||
|
||||||||
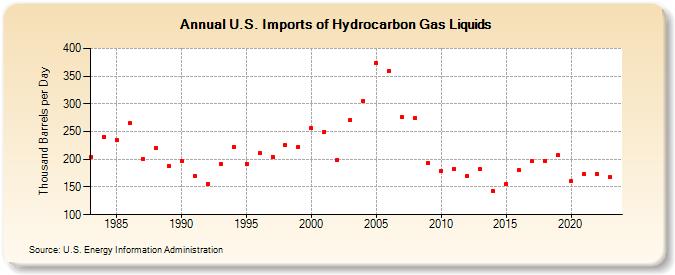
| U.S. Imports of Hydrocarbon Gas Liquids (Thousand Barrels per Day) | ||||||||
| Decade | Year-0 | Year-1 | Year-2 | Year-3 | Year-4 | Year-5 | Year-6 | Year-7 | Year-8 | Year-9 |
|---|---|---|---|---|---|---|---|---|---|---|
| 1980's | 205 | 241 | 235 | 265 | 201 | 221 | 188 | |||
| 1990's | 197 | 170 | 156 | 192 | 223 | 192 | 211 | 205 | 225 | 223 |
| 2000's | 256 | 250 | 199 | 271 | 305 | 374 | 360 | 276 | 275 | 194 |
| 2010's | 179 | 183 | 170 | 182 | 143 | 156 | 180 | 196 | 197 | 207 |
| 2020's | 160 | 173 | 174 | 168 |
| - = No Data Reported; -- = Not Applicable; NA = Not Available; W = Withheld to avoid disclosure of individual company data. |
| Release Date: 4/30/2024 |
| Next Release Date: 8/30/2024 |