|
Download Data (XLS File) |
|
||||||||
|
||||||||
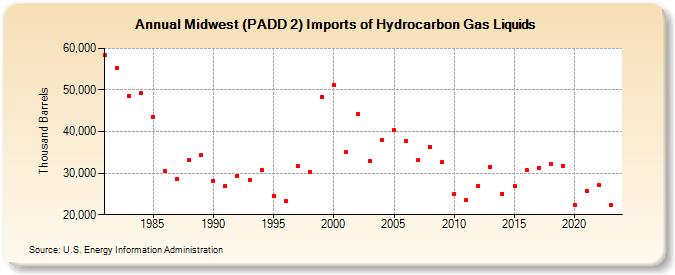
| Midwest (PADD 2) Imports of Hydrocarbon Gas Liquids (Thousand Barrels) | ||||||||
| Decade | Year-0 | Year-1 | Year-2 | Year-3 | Year-4 | Year-5 | Year-6 | Year-7 | Year-8 | Year-9 |
|---|---|---|---|---|---|---|---|---|---|---|
| 1980's | 58,317 | 55,336 | 48,570 | 49,175 | 43,519 | 30,422 | 28,520 | 33,052 | 34,417 | |
| 1990's | 28,221 | 26,891 | 29,385 | 28,426 | 30,763 | 24,590 | 23,399 | 31,757 | 30,327 | 48,319 |
| 2000's | 51,196 | 35,035 | 44,254 | 32,846 | 37,855 | 40,257 | 37,698 | 33,085 | 36,286 | 32,564 |
| 2010's | 25,072 | 23,535 | 27,019 | 31,512 | 25,071 | 26,983 | 30,671 | 31,144 | 32,151 | 31,735 |
| 2020's | 22,389 | 25,792 | 27,030 | 22,453 |
| - = No Data Reported; -- = Not Applicable; NA = Not Available; W = Withheld to avoid disclosure of individual company data. |
| Release Date: 3/29/2024 |
| Next Release Date: 8/30/2024 |