|
Download Data (XLS File) |
|
||||||||
|
||||||||
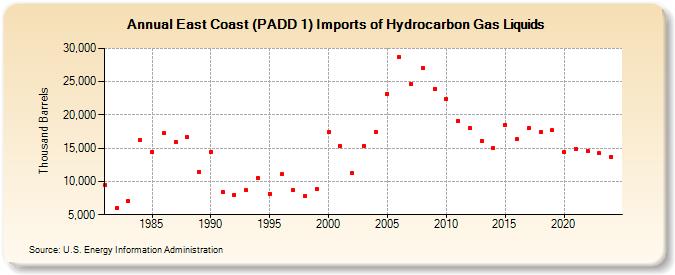
| East Coast (PADD 1) Imports of Hydrocarbon Gas Liquids (Thousand Barrels) | ||||||||
| Decade | Year-0 | Year-1 | Year-2 | Year-3 | Year-4 | Year-5 | Year-6 | Year-7 | Year-8 | Year-9 |
|---|---|---|---|---|---|---|---|---|---|---|
| 1980's | 9,519 | 5,956 | 7,051 | 16,223 | 14,491 | 17,281 | 15,938 | 16,694 | 11,456 | |
| 1990's | 14,492 | 8,429 | 8,037 | 8,662 | 10,537 | 8,154 | 11,052 | 8,649 | 7,786 | 8,838 |
| 2000's | 17,361 | 15,259 | 11,224 | 15,307 | 17,445 | 23,191 | 28,674 | 24,656 | 27,031 | 23,943 |
| 2010's | 22,455 | 19,121 | 18,043 | 16,094 | 15,014 | 18,503 | 16,342 | 18,025 | 17,407 | 17,670 |
| 2020's | 14,385 | 14,926 | 14,585 | 14,229 |
| - = No Data Reported; -- = Not Applicable; NA = Not Available; W = Withheld to avoid disclosure of individual company data. |
| Release Date: 8/30/2024 |
| Next Release Date: 8/29/2025 |