|
Download Data (XLS File) |
|
||||||||
|
||||||||
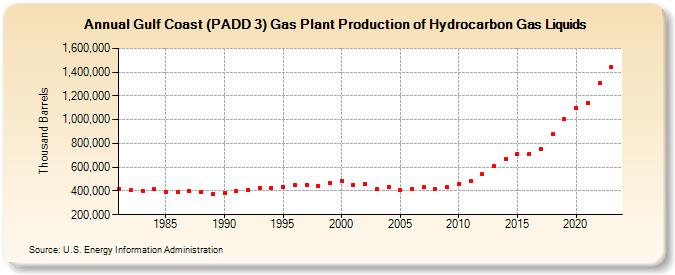
| Gulf Coast (PADD 3) Gas Plant Production of Hydrocarbon Gas Liquids (Thousand Barrels) | ||||||||
| Decade | Year-0 | Year-1 | Year-2 | Year-3 | Year-4 | Year-5 | Year-6 | Year-7 | Year-8 | Year-9 |
|---|---|---|---|---|---|---|---|---|---|---|
| 1980's | 416,768 | 405,839 | 403,800 | 415,955 | 394,840 | 393,339 | 395,804 | 393,702 | 378,190 | |
| 1990's | 381,887 | 399,885 | 411,992 | 423,953 | 422,830 | 433,593 | 448,781 | 453,080 | 445,042 | 469,559 |
| 2000's | 484,393 | 454,320 | 460,070 | 412,905 | 436,314 | 409,777 | 419,491 | 429,981 | 412,253 | 430,431 |
| 2010's | 457,454 | 479,646 | 540,336 | 606,848 | 669,470 | 713,764 | 710,874 | 751,147 | 875,906 | 1,004,662 |
| 2020's | 1,100,239 | 1,143,484 | 1,312,686 | 1,441,615 |
| - = No Data Reported; -- = Not Applicable; NA = Not Available; W = Withheld to avoid disclosure of individual company data. |
| Release Date: 3/29/2024 |
| Next Release Date: 8/30/2024 |