|
Download Data (XLS File) |
|
||||||||
|
||||||||
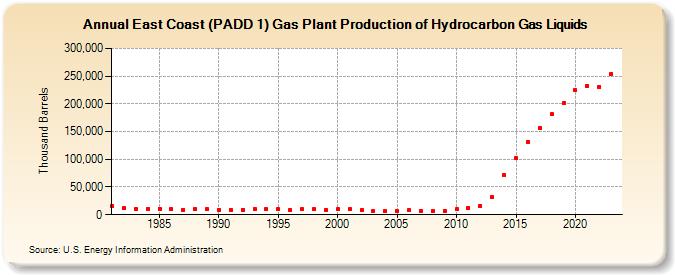
| East Coast (PADD 1) Gas Plant Production of Hydrocarbon Gas Liquids (Thousand Barrels) | ||||||||
| Decade | Year-0 | Year-1 | Year-2 | Year-3 | Year-4 | Year-5 | Year-6 | Year-7 | Year-8 | Year-9 |
|---|---|---|---|---|---|---|---|---|---|---|
| 1980's | 15,429 | 12,038 | 10,514 | 10,757 | 10,865 | 9,530 | 9,340 | 9,971 | 10,195 | |
| 1990's | 9,169 | 8,775 | 9,404 | 10,071 | 9,521 | 9,488 | 7,678 | 9,446 | 9,564 | 9,395 |
| 2000's | 9,447 | 9,421 | 8,287 | 6,400 | 6,510 | 6,273 | 8,019 | 7,312 | 6,751 | 7,365 |
| 2010's | 9,692 | 12,991 | 16,548 | 31,631 | 70,807 | 101,401 | 132,038 | 155,956 | 181,518 | 201,306 |
| 2020's | 224,504 | 231,829 | 231,111 | 253,982 |
| - = No Data Reported; -- = Not Applicable; NA = Not Available; W = Withheld to avoid disclosure of individual company data. |
| Release Date: 3/29/2024 |
| Next Release Date: 8/30/2024 |