|
Download Data (XLS File) |
|
||||||||
|
||||||||
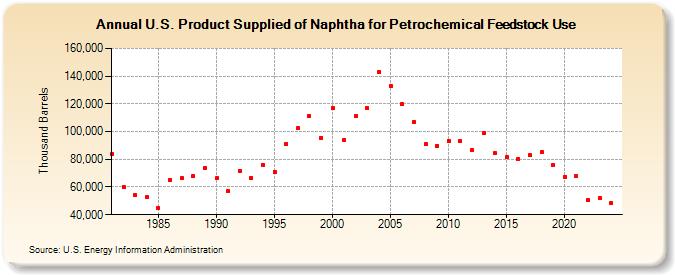
| U.S. Product Supplied of Naphtha for Petrochemical Feedstock Use (Thousand Barrels) | ||||||||
| Decade | Year-0 | Year-1 | Year-2 | Year-3 | Year-4 | Year-5 | Year-6 | Year-7 | Year-8 | Year-9 |
|---|---|---|---|---|---|---|---|---|---|---|
| 1980's | 83,940 | 60,238 | 54,067 | 52,612 | 44,931 | 65,050 | 66,292 | 67,756 | 74,044 | |
| 1990's | 66,273 | 56,964 | 71,861 | 66,805 | 75,903 | 71,068 | 91,332 | 102,206 | 111,279 | 95,670 |
| 2000's | 116,908 | 94,077 | 111,005 | 116,798 | 142,803 | 133,130 | 119,827 | 107,175 | 90,925 | 89,914 |
| 2010's | 93,478 | 92,858 | 86,494 | 98,673 | 84,338 | 81,566 | 80,035 | 83,113 | 85,192 | 75,589 |
| 2020's | 67,570 | 67,610 | 50,593 | 51,819 |
| - = No Data Reported; -- = Not Applicable; NA = Not Available; W = Withheld to avoid disclosure of individual company data. |
| Release Date: 4/30/2024 |
| Next Release Date: 8/30/2024 |