|
Download Data (XLS File) |
|
||||||||
|
||||||||
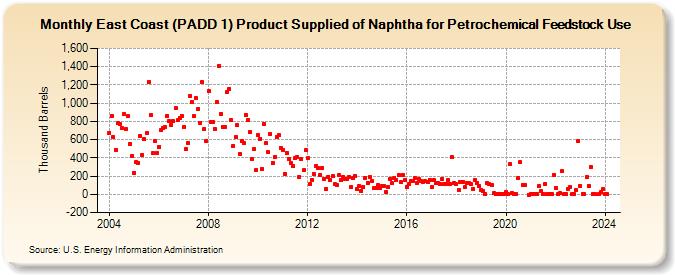
| East Coast (PADD 1) Product Supplied of Naphtha for Petrochemical Feedstock Use (Thousand Barrels) | ||||||||
| Year | Jan | Feb | Mar | Apr | May | Jun | Jul | Aug | Sep | Oct | Nov | Dec |
|---|---|---|---|---|---|---|---|---|---|---|---|---|
| 2004 | 677 | 859 | 631 | 489 | 777 | 768 | 732 | 882 | 714 | 855 | 556 | 425 |
| 2005 | 239 | 355 | 348 | 641 | 433 | 603 | 669 | 1,232 | 869 | 453 | 587 | 455 |
| 2006 | 524 | 702 | 725 | 739 | 864 | 802 | 764 | 799 | 941 | 812 | 842 | 864 |
| 2007 | 739 | 493 | 561 | 1,082 | 1,017 | 858 | 1,055 | 938 | 785 | 1,228 | 717 | 587 |
| 2008 | 1,129 | 791 | 793 | 716 | 1,013 | 1,409 | 882 | 737 | 738 | 1,126 | 1,156 | 813 |
| 2009 | 528 | 630 | 760 | 444 | 583 | 558 | 870 | 814 | 683 | 387 | 496 | 266 |
| 2010 | 650 | 612 | 281 | 776 | 558 | 459 | 663 | 344 | 408 | 630 | 647 | 512 |
| 2011 | 482 | 222 | 458 | 382 | 338 | 311 | 395 | 410 | 195 | 383 | 263 | 483 |
| 2012 | 393 | 112 | 162 | 225 | 309 | 287 | 217 | 293 | 173 | 58 | 195 | 154 |
| 2013 | 203 | 108 | 102 | 208 | 154 | 189 | 171 | 167 | 193 | 83 | 176 | 200 |
| 2014 | 54 | 90 | 40 | 81 | 181 | 126 | 191 | 146 | 66 | 69 | 97 | 69 |
| 2015 | 92 | 90 | 30 | 82 | 170 | 121 | 181 | 162 | 210 | 135 | 213 | 153 |
| 2016 | 85 | 115 | 142 | 146 | 180 | 126 | 173 | 142 | 137 | 141 | 135 | 161 |
| 2017 | 77 | 152 | 119 | 123 | 112 | 169 | 117 | 118 | 153 | 115 | 406 | 122 |
| 2018 | 109 | 48 | 133 | 137 | 78 | 122 | 121 | 110 | 56 | 158 | 123 | 90 |
| 2019 | 52 | 32 | 7 | 119 | 108 | 102 | 10 | 0 | 0 | 4 | 3 | 1 |
| 2020 | 21 | 0 | 332 | 17 | 3 | 3 | 180 | 354 | 100 | 100 | -4 | |
| 2021 | 3 | 3 | 4 | 7 | 90 | 33 | 7 | 117 | 3 | 4 | 1 | 212 |
| 2022 | 73 | 1 | 10 | 254 | 2 | 2 | 63 | 75 | 3 | 1 | 44 | 584 |
| 2023 | 93 | 2 | 2 | 189 | 94 | 303 | 2 | 3 | 1 | 21 | 63 | |
| 2024 | 1 | |||||||||||
| - = No Data Reported; -- = Not Applicable; NA = Not Available; W = Withheld to avoid disclosure of individual company data. |
| Release Date: 3/29/2024 |
| Next Release Date: 4/30/2024 |