|
Download Data (XLS File) |
|
||||||||
|
||||||||
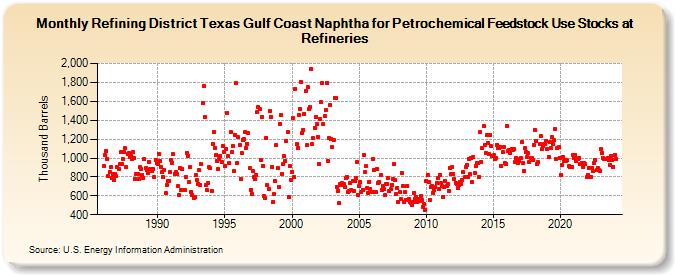
| Refining District Texas Gulf Coast Naphtha for Petrochemical Feedstock Use Stocks at Refineries (Thousand Barrels) | ||||||||
| Year | Jan | Feb | Mar | Apr | May | Jun | Jul | Aug | Sep | Oct | Nov | Dec |
|---|---|---|---|---|---|---|---|---|---|---|---|---|
| 1986 | 916 | 1,030 | 1,078 | 985 | 810 | 853 | 902 | 793 | 831 | 768 | 835 | 809 |
| 1987 | 908 | 881 | 933 | 1,060 | 934 | 993 | 1,063 | 1,103 | 904 | 1,042 | 1,050 | 1,012 |
| 1988 | 1,016 | 990 | 1,061 | 997 | 780 | 826 | 833 | 775 | 902 | 881 | 816 | 793 |
| 1989 | 985 | 891 | 870 | 842 | 962 | 879 | 886 | 862 | 887 | 798 | 979 | 944 |
| 1990 | 934 | 1,042 | 969 | 904 | 854 | 800 | 872 | 627 | 717 | 758 | 753 | 854 |
| 1991 | 977 | 950 | 1,038 | 829 | 848 | 834 | 701 | 612 | 892 | 664 | 879 | 659 |
| 1992 | 663 | 800 | 1,055 | 1,025 | 741 | 901 | 641 | 608 | 578 | 588 | 817 | 762 |
| 1993 | 729 | 868 | 712 | 933 | 1,583 | 1,761 | 1,433 | 715 | 660 | 735 | 901 | 890 |
| 1994 | 653 | 1,148 | 1,280 | 1,109 | 1,028 | 973 | 883 | 987 | 1,019 | 957 | 1,126 | 1,066 |
| 1995 | 913 | 1,096 | 1,472 | 1,017 | 948 | 1,276 | 1,060 | 1,127 | 859 | 1,247 | 1,793 | 949 |
| 1996 | 1,219 | 1,140 | 779 | 1,051 | 1,195 | 1,204 | 1,275 | 1,102 | 1,152 | 1,263 | 892 | 659 |
| 1997 | 623 | 858 | 797 | 773 | 825 | 1,491 | 1,535 | 1,518 | 978 | 1,435 | 918 | 593 |
| 1998 | 572 | 1,211 | 712 | 670 | 1,499 | 1,433 | 905 | 533 | 616 | 754 | 1,136 | 893 |
| 1999 | 698 | 1,363 | 1,457 | 834 | 932 | 1,016 | 972 | 1,177 | 1,270 | 584 | 916 | 769 |
| 2000 | 853 | 1,423 | 796 | 1,733 | 1,148 | 1,102 | 1,459 | 1,521 | 1,805 | 1,263 | 1,300 | 1,470 |
| 2001 | 1,707 | 1,133 | 1,750 | 1,517 | 1,537 | 1,938 | 1,144 | 1,209 | 1,319 | 1,433 | 1,356 | 1,227 |
| 2002 | 937 | 1,416 | 1,588 | 1,793 | 1,359 | 1,442 | 1,506 | 1,797 | 969 | 1,209 | 1,563 | 1,200 |
| 2003 | 1,112 | 1,188 | 1,635 | 1,640 | 693 | 655 | 525 | 730 | 710 | 732 | 724 | 689 |
| 2004 | 787 | 802 | 645 | 651 | 734 | 663 | 753 | 648 | 754 | 793 | 953 | 613 |
| 2005 | 706 | 743 | 645 | 661 | 1,034 | 847 | 911 | 682 | 627 | 751 | 671 | 645 |
| 2006 | 990 | 875 | 639 | 636 | 885 | 737 | 750 | 825 | 662 | 707 | 670 | 605 |
| 2007 | 720 | 727 | 792 | 647 | 668 | 716 | 779 | 933 | 762 | 624 | 686 | 532 |
| 2008 | 637 | 568 | 842 | 700 | 532 | 636 | 559 | 704 | 563 | 530 | 527 | 499 |
| 2009 | 535 | 630 | 562 | 589 | 539 | 570 | 550 | 603 | 552 | 485 | 512 | 449 |
| 2010 | 761 | 822 | 746 | 560 | 697 | 704 | 632 | 659 | 693 | 738 | 788 | 675 |
| 2011 | 822 | 732 | 703 | 592 | 689 | 752 | 706 | 720 | 651 | 889 | 828 | 905 |
| 2012 | 836 | 777 | 739 | 725 | 681 | 715 | 749 | 723 | 770 | 851 | 794 | 901 |
| 2013 | 921 | 803 | 994 | 833 | 997 | 750 | 1,012 | 840 | 916 | 943 | 943 | 802 |
| 2014 | 1,274 | 956 | 1,107 | 1,337 | 1,140 | 1,057 | 1,240 | 1,156 | 1,038 | 1,244 | 1,123 | 1,022 |
| 2015 | 1,029 | 989 | 999 | 1,141 | 1,104 | 1,109 | 1,119 | 912 | 1,063 | 1,119 | 946 | 935 |
| 2016 | 1,337 | 1,078 | 1,087 | 1,051 | 1,095 | 1,080 | 1,100 | 962 | 996 | 991 | 952 | 965 |
| 2017 | 999 | 1,168 | 943 | 866 | 1,101 | 1,068 | 1,014 | 1,048 | 954 | 1,004 | 1,001 | 980 |
| 2018 | 1,141 | 1,299 | 1,178 | 938 | 955 | 1,144 | 1,238 | 1,093 | 1,123 | 1,147 | 1,143 | 1,181 |
| 2019 | 1,097 | 1,014 | 1,165 | 1,105 | 1,222 | 1,153 | 1,190 | 1,306 | 992 | 1,108 | 1,112 | 1,003 |
| 2020 | 824 | 928 | 1,012 | 968 | 978 | 971 | 976 | 914 | 910 | 903 | 906 | 1,027 |
| 2021 | 1,001 | 1,031 | 966 | 994 | 1,000 | 938 | 940 | 952 | 910 | 952 | 933 | 795 |
| 2022 | 822 | 896 | 802 | 795 | 895 | 858 | 948 | 976 | 873 | 897 | 875 | 865 |
| 2023 | 1,094 | 1,058 | 1,002 | 992 | 993 | 993 | 1,000 | 978 | 925 | 1,019 | 977 | 909 |
| 2024 | 1,032 | |||||||||||
| - = No Data Reported; -- = Not Applicable; NA = Not Available; W = Withheld to avoid disclosure of individual company data. |
| Release Date: 3/29/2024 |
| Next Release Date: 4/30/2024 |