|
Download Data (XLS File) |
|
||||||||
|
||||||||
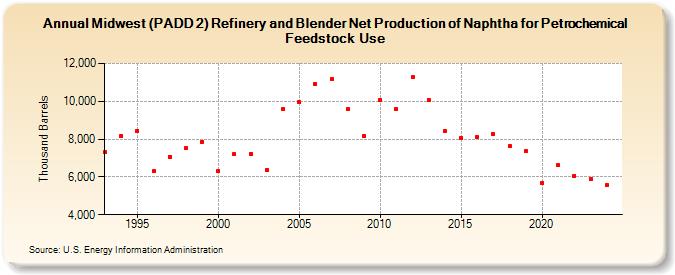
| Midwest (PADD 2) Refinery and Blender Net Production of Naphtha for Petrochemical Feedstock Use (Thousand Barrels) | ||||||||
| Decade | Year-0 | Year-1 | Year-2 | Year-3 | Year-4 | Year-5 | Year-6 | Year-7 | Year-8 | Year-9 |
|---|---|---|---|---|---|---|---|---|---|---|
| 1990's | 7,298 | 8,172 | 8,448 | 6,305 | 7,072 | 7,512 | 7,872 | |||
| 2000's | 6,315 | 7,194 | 7,231 | 6,362 | 9,591 | 9,945 | 10,921 | 11,177 | 9,577 | 8,176 |
| 2010's | 10,085 | 9,575 | 11,269 | 10,092 | 8,447 | 8,066 | 8,093 | 8,252 | 7,640 | 7,351 |
| 2020's | 5,699 | 6,605 | 6,065 | 5,902 |
| - = No Data Reported; -- = Not Applicable; NA = Not Available; W = Withheld to avoid disclosure of individual company data. |
| Release Date: 3/29/2024 |
| Next Release Date: 8/30/2024 |