|
Download Data (XLS File) |
|
||||||||
|
||||||||
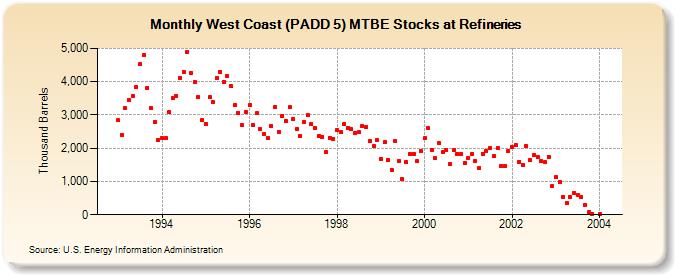
| West Coast (PADD 5) MTBE Stocks at Refineries (Thousand Barrels) | ||||||||
| Year | Jan | Feb | Mar | Apr | May | Jun | Jul | Aug | Sep | Oct | Nov | Dec |
|---|---|---|---|---|---|---|---|---|---|---|---|---|
| 1993 | 2,833 | 2,408 | 3,198 | 3,451 | 3,576 | 3,832 | 4,525 | 4,798 | 3,813 | 3,194 | 2,790 | 2,239 |
| 1994 | 2,309 | 2,293 | 3,087 | 3,515 | 3,577 | 4,114 | 4,302 | 4,902 | 4,274 | 3,998 | 3,545 | 2,850 |
| 1995 | 2,742 | 3,531 | 3,393 | 4,122 | 4,302 | 3,990 | 4,156 | 3,859 | 3,284 | 3,052 | 2,691 | 3,088 |
| 1996 | 3,298 | 2,694 | 3,047 | 2,580 | 2,441 | 2,293 | 2,681 | 3,249 | 2,493 | 2,969 | 2,817 | 3,225 |
| 1997 | 2,874 | 2,584 | 2,366 | 2,793 | 2,986 | 2,731 | 2,620 | 2,376 | 2,347 | 1,899 | 2,320 | 2,281 |
| 1998 | 2,544 | 2,486 | 2,722 | 2,600 | 2,573 | 2,466 | 2,478 | 2,663 | 2,645 | 2,202 | 2,064 | 2,234 |
| 1999 | 1,674 | 2,176 | 1,649 | 1,356 | 2,206 | 1,624 | 1,067 | 1,592 | 1,831 | 1,840 | 1,608 | 1,909 |
| 2000 | 2,296 | 2,602 | 1,936 | 1,691 | 2,145 | 1,881 | 1,941 | 1,513 | 1,944 | 1,831 | 1,840 | 1,545 |
| 2001 | 1,707 | 1,833 | 1,608 | 1,412 | 1,833 | 1,919 | 1,999 | 1,761 | 2,015 | 1,462 | 1,458 | 1,915 |
| 2002 | 2,029 | 2,096 | 1,597 | 1,504 | 2,055 | 1,639 | 1,792 | 1,739 | 1,605 | 1,572 | 1,750 | 867 |
| 2003 | 1,126 | 978 | 545 | 356 | 533 | 663 | 600 | 528 | 284 | 68 | 22 | |
| 2004 | 11 | |||||||||||
| - = No Data Reported; -- = Not Applicable; NA = Not Available; W = Withheld to avoid disclosure of individual company data. |
| Release Date: 3/29/2024 |
| Next Release Date: 4/30/2024 |