|
Download Data (XLS File) |
|
||||||||
|
||||||||
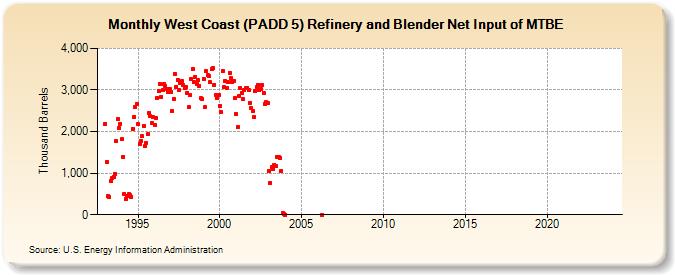
| West Coast (PADD 5) Refinery and Blender Net Input of MTBE (Thousand Barrels) | ||||||||
| Year | Jan | Feb | Mar | Apr | May | Jun | Jul | Aug | Sep | Oct | Nov | Dec |
|---|---|---|---|---|---|---|---|---|---|---|---|---|
| 1993 | 2,183 | 1,268 | 447 | 424 | 806 | 892 | 917 | 988 | 1,763 | 2,302 | 2,083 | 2,192 |
| 1994 | 1,812 | 1,397 | 495 | 389 | 444 | 492 | 465 | 435 | 2,070 | 2,354 | 2,602 | 2,671 |
| 1995 | 2,173 | 1,689 | 1,773 | 1,885 | 2,130 | 1,658 | 1,729 | 1,934 | 2,449 | 2,371 | 2,212 | 2,345 |
| 1996 | 2,164 | 2,327 | 2,816 | 2,964 | 3,148 | 2,831 | 2,997 | 3,155 | 3,099 | 3,021 | 2,962 | 3,028 |
| 1997 | 2,951 | 2,498 | 2,793 | 3,391 | 3,078 | 3,243 | 3,002 | 3,168 | 3,213 | 3,123 | 3,046 | 3,077 |
| 1998 | 2,934 | 2,585 | 2,877 | 3,261 | 3,499 | 3,194 | 3,322 | 3,136 | 3,239 | 3,098 | 2,797 | 2,788 |
| 1999 | 3,258 | 2,580 | 3,448 | 3,358 | 3,326 | 3,183 | 3,500 | 3,521 | 3,126 | 2,874 | 2,808 | 2,871 |
| 2000 | 2,618 | 2,471 | 3,460 | 3,068 | 3,218 | 3,054 | 3,195 | 3,416 | 3,285 | 3,198 | 3,222 | 2,795 |
| 2001 | 2,423 | 2,111 | 2,845 | 3,050 | 2,929 | 2,781 | 3,008 | 3,039 | 3,050 | 2,988 | 2,697 | 2,561 |
| 2002 | 2,495 | 2,346 | 2,973 | 3,070 | 3,126 | 2,989 | 3,034 | 3,121 | 2,934 | 2,665 | 2,699 | 2,689 |
| 2003 | 1,053 | 767 | 1,143 | 1,101 | 1,207 | 1,163 | 1,386 | 1,396 | 1,353 | 1,052 | 47 | 22 |
| 2004 | 0 | |||||||||||
| 2006 | 3 | |||||||||||
| 2019 | -- | -- | -- | -- | -- | -- | -- | -- | -- | -- | -- | -- |
| 2020 | -- | -- | -- | -- | -- | -- | -- | -- | -- | -- | -- | -- |
| 2021 | -- | -- | -- | -- | -- | -- | -- | -- | -- | -- | -- | |
| 2022 | -- | -- | -- | -- | -- | -- | -- | -- | -- | -- | -- | -- |
| 2023 | -- | -- | -- | -- | -- | -- | -- | -- | -- | -- | -- | -- |
| 2024 | -- | |||||||||||
| - = No Data Reported; -- = Not Applicable; NA = Not Available; W = Withheld to avoid disclosure of individual company data. |
| Release Date: 3/29/2024 |
| Next Release Date: 4/30/2024 |