|
Download Data (XLS File) |
|
||||||||
|
||||||||
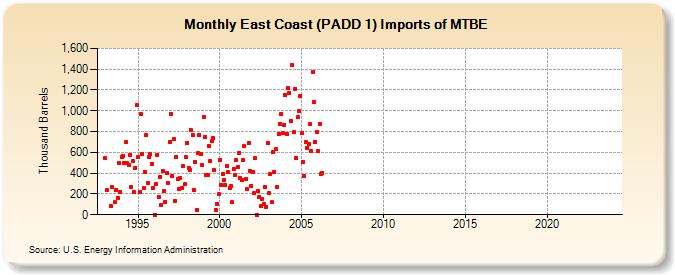
| East Coast (PADD 1) Imports of MTBE (Thousand Barrels) | ||||||||
| Year | Jan | Feb | Mar | Apr | May | Jun | Jul | Aug | Sep | Oct | Nov | Dec |
|---|---|---|---|---|---|---|---|---|---|---|---|---|
| 1993 | 542 | 233 | 83 | 262 | 120 | 240 | 164 | 502 | 218 | |||
| 1994 | 557 | 568 | 494 | 700 | 493 | 475 | 578 | 268 | 516 | 219 | 450 | 1,051 |
| 1995 | 555 | 215 | 965 | 587 | 256 | 411 | 763 | 309 | 556 | 580 | 490 | 259 |
| 1996 | 0 | 297 | 577 | 173 | 361 | 89 | 424 | 228 | 123 | 405 | 307 | 698 |
| 1997 | 970 | 373 | 728 | 133 | 560 | 344 | 244 | 353 | 255 | 465 | 293 | 553 |
| 1998 | 693 | 454 | 432 | 812 | 767 | 241 | 508 | 47 | 591 | 766 | 585 | 475 |
| 1999 | 941 | 751 | 386 | 382 | 657 | 514 | 708 | 736 | 428 | 47 | 106 | 195 |
| 2000 | 530 | 289 | 395 | 334 | 287 | 465 | 411 | 261 | 273 | 119 | 440 | 385 |
| 2001 | 522 | 457 | 598 | 353 | 331 | 525 | 657 | 348 | 243 | 688 | 425 | 275 |
| 2002 | 408 | 205 | 550 | 0 | 231 | 169 | 81 | 152 | 106 | 266 | 70 | 691 |
| 2003 | 208 | 391 | 121 | 600 | 413 | 633 | 269 | 780 | 877 | 972 | 783 | 866 |
| 2004 | 1,150 | 778 | 1,218 | 1,174 | 904 | 1,440 | 793 | 1,212 | 549 | 936 | 994 | 1,145 |
| 2005 | 788 | 511 | 370 | 695 | 645 | 680 | 868 | 610 | 1,369 | 1,088 | 701 | 799 |
| 2006 | 610 | 873 | 387 | 402 | ||||||||
| 2019 | -- | -- | -- | -- | -- | -- | -- | -- | -- | -- | -- | -- |
| 2020 | -- | -- | -- | -- | -- | -- | -- | -- | -- | -- | -- | -- |
| 2021 | -- | -- | -- | -- | -- | -- | -- | -- | -- | -- | -- | |
| 2022 | -- | -- | -- | -- | -- | -- | -- | -- | -- | -- | -- | -- |
| 2023 | -- | -- | -- | -- | -- | -- | -- | -- | -- | -- | -- | -- |
| 2024 | -- | |||||||||||
| - = No Data Reported; -- = Not Applicable; NA = Not Available; W = Withheld to avoid disclosure of individual company data. |
| Release Date: 3/29/2024 |
| Next Release Date: 4/30/2024 |