|
Download Data (XLS File) |
|
||||||||
|
||||||||
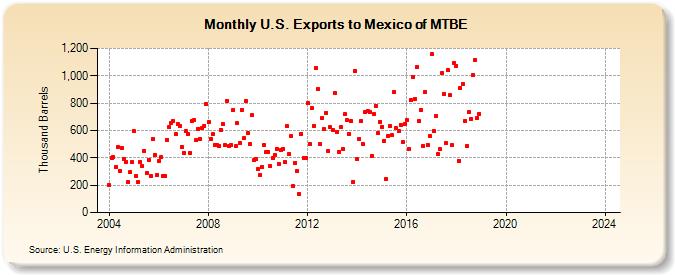
| U.S. Exports to Mexico of MTBE (Thousand Barrels) | ||||||||
| Year | Jan | Feb | Mar | Apr | May | Jun | Jul | Aug | Sep | Oct | Nov | Dec |
|---|---|---|---|---|---|---|---|---|---|---|---|---|
| 2004 | 199 | 401 | 404 | 334 | 480 | 303 | 475 | 394 | 370 | 221 | 293 | 366 |
| 2005 | 594 | 266 | 223 | 369 | 341 | 449 | 287 | 387 | 266 | 539 | 420 | 274 |
| 2006 | 380 | 403 | 267 | 265 | 534 | 624 | 654 | 666 | 574 | 647 | 632 | 481 |
| 2007 | 437 | 594 | 573 | 437 | 671 | 675 | 528 | 614 | 537 | 617 | 636 | 794 |
| 2008 | 661 | 537 | 571 | 495 | 496 | 489 | 606 | 644 | 493 | 818 | 488 | 494 |
| 2009 | 748 | 483 | 652 | 507 | 753 | 543 | 814 | 578 | 501 | 711 | 383 | 390 |
| 2010 | 317 | 274 | 334 | 492 | 446 | 444 | 340 | 396 | 419 | 468 | 356 | 454 |
| 2011 | 465 | 368 | 631 | 431 | 559 | 193 | 365 | 301 | 134 | 577 | 401 | 397 |
| 2012 | 798 | 501 | 761 | 636 | 1,059 | 904 | 498 | 690 | 609 | 731 | 447 | 623 |
| 2013 | 607 | 872 | 592 | 446 | 622 | 465 | 718 | 676 | 577 | 671 | 225 | 1,033 |
| 2014 | 391 | 540 | 667 | 499 | 737 | 744 | 732 | 416 | 719 | 782 | 583 | 664 |
| 2015 | 627 | 526 | 246 | 563 | 632 | 564 | 884 | 618 | 594 | 643 | 517 | 650 |
| 2016 | 678 | 463 | 821 | 993 | 831 | 1,064 | 667 | 751 | 490 | 880 | 494 | 563 |
| 2017 | 1,156 | 596 | 703 | 425 | 461 | 1,020 | 865 | 507 | 1,039 | 856 | 491 | 1,092 |
| 2018 | 1,072 | 378 | 907 | 938 | 670 | 484 | 733 | 686 | 1,005 | 1,115 | 692 | 723 |
| 2019 | -- | -- | -- | -- | -- | -- | -- | -- | -- | -- | -- | -- |
| 2020 | -- | -- | -- | -- | -- | -- | -- | -- | -- | -- | -- | -- |
| 2021 | -- | -- | -- | -- | -- | -- | -- | -- | -- | -- | -- | |
| 2022 | -- | -- | -- | -- | -- | -- | -- | -- | -- | -- | -- | -- |
| 2023 | -- | -- | -- | -- | -- | -- | -- | -- | -- | -- | -- | -- |
| 2024 | -- | |||||||||||
| - = No Data Reported; -- = Not Applicable; NA = Not Available; W = Withheld to avoid disclosure of individual company data. |
| Release Date: 3/29/2024 |
| Next Release Date: 4/30/2024 |